Free Audio RMS vs Peak Volume Difference Analyzer— gemini-3.0-flash
gemini-3.0-flashAnalyze your audio track's dynamic range instantly. Measure Peak vs RMS levels, calculate the crest factor, and visualize the signal difference for free.
AI Generation Prompt
Audio RMS vs. Peak Volume Difference Visualizer
Overview
A professional-grade, browser-based utility designed for audio engineers, producers, and musicians to analyze the dynamic range of audio files. The tool extracts Peak and RMS values in real-time, providing actionable insights into signal dynamics, crest factor, and mastering balance.
Technical Specification & Constraints
- Architecture: Single-file HTML5 application (HTML/CSS/Vanilla JS).
- Sandboxed Compatibility: Absolutely no use of
localStorage,sessionStorage,IndexedDB, or cookies. The tool must operate entirely in volatile memory. - No External Servers: All processing happens via the
Web Audio APIon the client side. - Design Aesthetic: Clean, vibrant, "SaaS-style" light-mode interface. High-contrast typography and subtle elevation shadows.
UI/UX Layout
- Header: Clean title area with a brief helper tooltip.
- File Upload Zone: A large, drag-and-drop enabled container with high-visibility call-to-action.
- Dashboard Area:
- Primary Metric Cards: Three cards displaying "Peak Level (dBFS)", "RMS Level (dBFS)", and "Crest Factor".
- Visualization Canvas: A dynamic, high-performance
<canvas>element plotting the audio waveform with an overlay line for RMS values and a distinct color for Peaks.
- Controls: Simple reset and "Export Data as CSV" (using Blob objects, no backend).
Design System (Light Mode Only)
- Palette:
- Background:
#f8fafc(Cool gray) - Surfaces:
#ffffff(White) - Primary Accent:
#2563eb(Modern Blue) - Text:
#1e293b(Slate) - Borders:
#e2e8f0
- Background:
- Typography: Inter or System-sans-serif, optimized for readability.
- Animations: Subtle fade-ins on results cards and smooth entry transitions for the canvas drawing. Avoid heavy motion; focus on performance.
Implementation Roadmap
- Audio Decoding: Use
AudioContext.decodeAudioData()to process local files. - Analysis Logic: Iterate through the
AudioBufferchannels to calculate the RMS windowed average versus the absolute Peak value. - Visualization: Implement a requestAnimationFrame loop to render the audio data onto a responsive canvas that resizes automatically to the container width.
- Export Logic: Use
URL.createObjectURLto create a virtual download link for the analysis data (CSV format) without needing a server.
Developer Instructions
- Responsiveness: Use CSS Grid and Flexbox. The dashboard must wrap to a single column on mobile devices.
- Accessibility: Ensure all inputs are keyboard accessible and have proper labels.
- Performance: For large files, implement the analysis in a non-blocking fashion using
Web Workersor chunked processing to prevent the browser UI from freezing.
Spread the word
gemini-3.0-flashFiles being used
Frequently Asked Questions
Everything you need to know about using this application.
What is the significance of the RMS vs. Peak difference?
The difference between Peak and RMS levels is essentially the crest factor of an audio signal. A larger difference suggests a high dynamic range with sharp transients, while a small difference typically indicates a compressed signal, common in modern mastered music. Understanding this gap helps producers and engineers make informed decisions regarding compression, limiting, and overall dynamic balance during the mixing and mastering process. It provides objective data rather than relying solely on perceived loudness or visual waveform inspection.
Is this tool secure and how is my data handled?
Yes, this tool operates entirely within your browser using the Web Audio API. Your audio files are never uploaded to a server, processed in the cloud, or stored in any database, ensuring your intellectual property remains secure. Since the processing happens locally on your machine, your data remains 100% private. Once you refresh or close the page, all information is cleared from your browser's memory, ensuring total privacy and no risk of data leakage.
How do I interpret the results from this analyzer?
The results provide both the Peak value (the absolute highest point of the waveform) and the RMS value (the average loudness level). By comparing these, you can determine how much 'headroom' you have before digital clipping occurs. A higher difference indicates a punchier, more dynamic sound, while a lower difference indicates a louder, denser sound profile. Use these metrics to ensure your audio meets the target loudness requirements for streaming platforms or physical media reproduction.
What audio formats are compatible with this tool?
This browser-based tool supports standard uncompressed and compressed audio formats commonly used in music production, including WAV, MP3, OGG, and FLAC. These formats are handled natively by your browser. Because it uses the native browser audio engine, compatibility depends on the specific browser you are using. For the best performance and highest accuracy, we recommend using a modern desktop browser like Chrome, Firefox, or Edge.
Related Applications
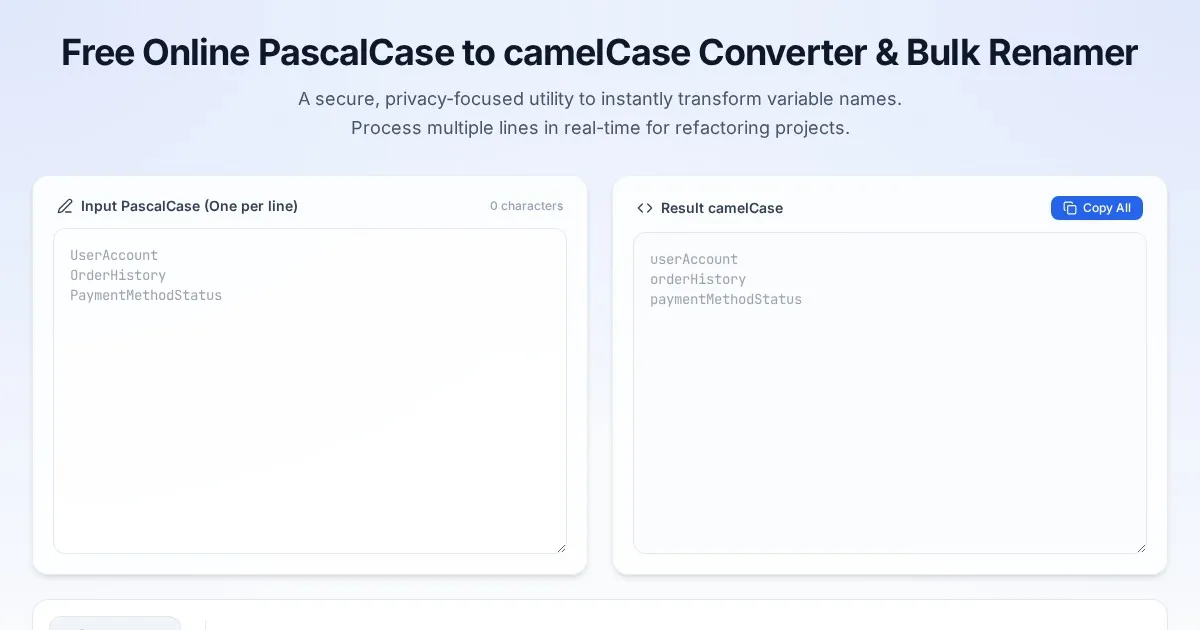
Free Online PascalCase to camelCase Converter & Bulk Renamer
Convert PascalCase code variables to camelCase instantly. A free, easy-to-use bulk variable renaming tool for developers. No server-side processing required.

Free Online Guitar Tablature Maker & Audio Player
Create, edit, and play your own guitar tablature arrangements with this free, interactive, browser-based guitar tab maker. No installation required.
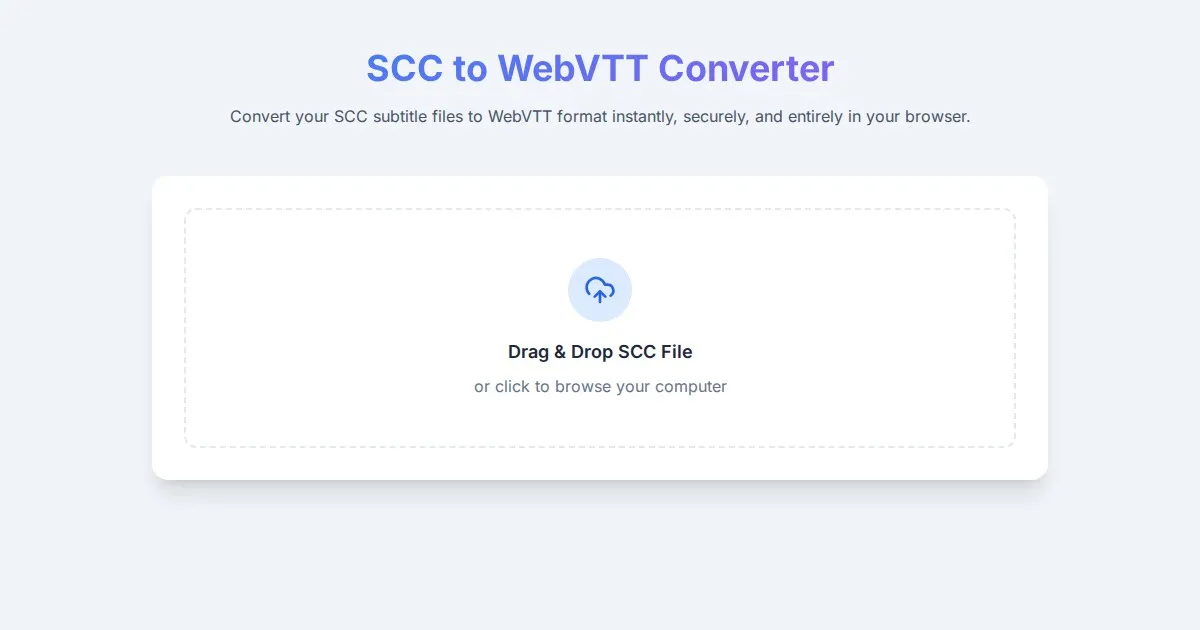
Free SCC to WebVTT Subtitle Converter Tool
Convert SCC subtitle files to WebVTT format online for free. Fast, secure, browser-based SCC to VTT conversion tool for video captioning and accessibility.
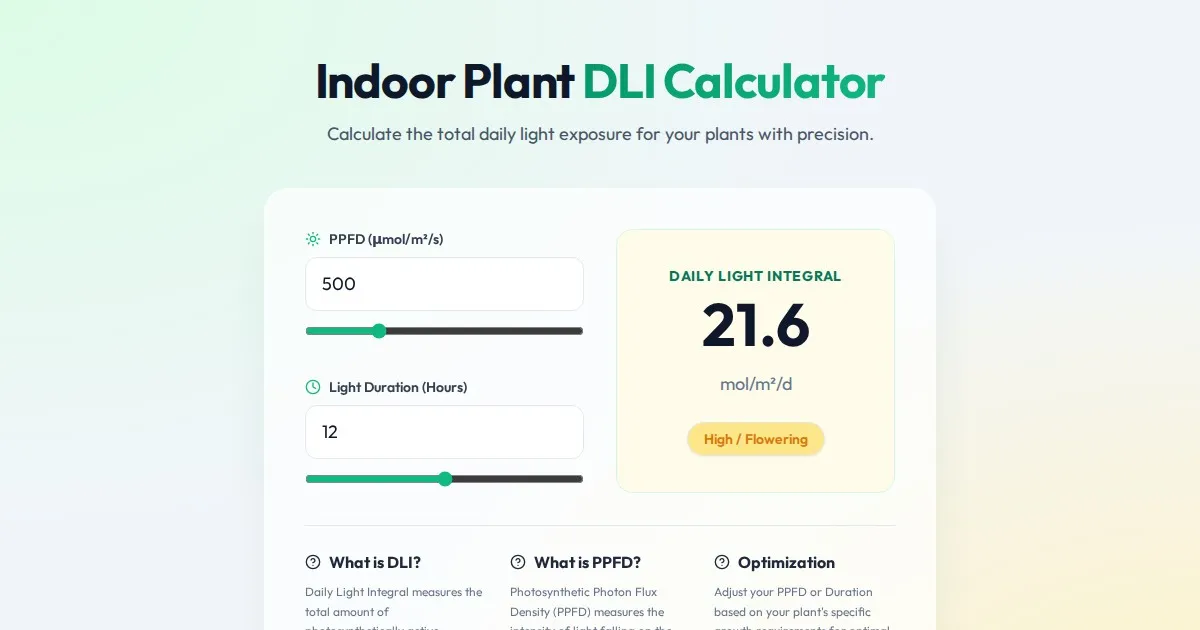
Free Indoor Plant Daily Light Integral (DLI) Calculator
Calculate the Daily Light Integral (DLI) and Photosynthetically Active Radiation (PAR) for your indoor plants. Optimize grow light hours and intensity today.
Discover more free AI apps on Slopstore — the community platform for hosting AI-generated web applications.