Free Benford's Law Fraud Detection Number Frequency Analyzer— gemini-3.0-flash
gemini-3.0-flashAnalyze datasets for potential irregularities using Benford's Law. This free online frequency analyzer detects leading digit anomalies to identify data bias.
AI Generation Prompt
Technical Specification: Benford's Law Anomaly Detector
Overview
A pure, client-side, browser-based tool designed for auditors, accountants, and data scientists to perform rapid Benford’s Law analysis on numerical datasets. The application allows users to paste raw data, automatically cleans and extracts leading digits, and provides a visual comparison against the expected Benford frequency distribution.
Architecture & Constraints
- Single File: All HTML, CSS, and Vanilla JavaScript are contained within a single file. No build processes or node modules required.
- Stateless: All data processing happens in-memory. NO use of
localStorage,sessionStorage, cookies, or persistent database connections. - Iframe Compatibility: Designed to run in sandboxed iframes. No browser popups (
alert,confirm); all UI modals are custom-built DOM elements. - Dependencies: Use CDN links for Chart.js (for visualization) and Tailwind CSS (for layout).
UI/UX Design
- Color Palette: Clean "SaaS" Light Mode aesthetic.
- Background:
#f8fafc(Slate 50) - Cards/Containers:
#ffffff(White) - Text:
#1e293b(Slate 800) - Accent (Primary):
#2563eb(Blue 600) - Alert Colors:
#e11d48(Rose 600) for anomalies,#16a34a(Green 600) for expected fits.
- Background:
- Layout:
- Header: Title and brief instruction text.
- Input Section: A large, responsive textarea for pasting comma/newline/space-separated numbers. A "Clear" button and an "Analyze" button.
- Results Dashboard:
- Top Metric Cards: Simple summary stats (Total numbers, Range, Identified potential anomalies).
- Visualization: A responsive bar chart showing the comparison between User Input vs. Expected Frequency.
- Data Table: A breakdown table showing digit 1-9, expected %, observed %, and deviation.
Core Features
- Data Parsing Engine:
- Regex-based extraction to filter out non-numeric noise (e.g., currency symbols, comma separators).
- Robust error handling for empty inputs, non-numeric strings, or zero-values.
- Frequency Calculation:
- Algorithmic generation of leading digit probabilities (log10(1 + 1/d)).
- Visualization:
- Using Chart.js to render a side-by-side bar chart (Expected vs. Observed).
- Hover states for tooltips displaying exact percentages.
- Interactive Report:
- A summary section that flags digits with deviations higher than 5% for closer human inspection.
- Export: A "Copy to Clipboard" button that formats the analysis into a Markdown table or CSV format.
Implementation Directives
- Responsive Design: Ensure the chart resizes dynamically using a wrapper container. The dashboard layout should switch from multi-column to single-column on mobile devices.
- Animations: Subtle
transitionproperties on buttons and cards. Use smooth CSS opacity fades when showing/hiding the results dashboard after analysis. - Modals: For error messages (e.g., "No valid numbers found"), inject a styled
divover the main content with a closing button, rather than using standard browser alerts.
Spread the word
gemini-3.0-flashFiles being used
Frequently Asked Questions
Everything you need to know about using this application.
What is Benford's Law and how does this tool use it?
Benford's Law, also known as the First-Digit Law, is an observation about the frequency distribution of leading digits in many real-life sets of numerical data. In such sets, the leading digit is 1 about 30% of the time, while larger digits occur much less frequently. This application uses mathematical algorithms to calculate the observed leading digit frequencies from your provided dataset. It then compares these observed percentages against the expected distribution defined by Benford's Law, highlighting significant deviations that may warrant further investigation.
Can this tool prove that fraud has occurred in my data?
No, this tool cannot definitively prove fraud. It is designed to be an exploratory data analysis utility that identifies anomalies, which are potential indicators of data manipulation or accounting irregularities rather than conclusive evidence. While a significant deviation from Benford's Law can suggest that data may not be 'natural' or could have been fabricated, it can also occur in perfectly valid datasets that do not meet the criteria for Benford's Law—such as data constrained by arbitrary maximums, minimums, or specific assigned categories. Always use this as a starting point for deeper investigation.
What type of data is most suitable for Benford's Law analysis?
Benford's Law generally applies best to datasets that span several orders of magnitude and are generated by processes where data points are multiplicative, such as financial transactions, population figures, or street addresses. These datasets often exhibit a wide distribution that naturally follows the expected logarithmic curve. Data that is not well-suited for this type of analysis includes datasets that have been artificially truncated, such as prices ending in $0.99, or datasets with a narrow range of values, such as ID numbers or survey responses limited to a 1-5 scale. Ensuring your input data has enough variety is critical for meaningful results.
How do I interpret the deviation results shown in the chart?
The application provides a comparative view between your observed data and the standard Benford distribution curve. A tight correlation indicates that your data follows the expected pattern, while bars that vary significantly above or below the expected line suggest a possible bias or outlier cluster. For professional auditing purposes, you should focus on the absolute deviation percentage. Small fluctuations are common, but consistent, large deviations across multiple digits are generally considered the primary red flags that deserve closer manual review by a financial or data analyst.
Related Applications
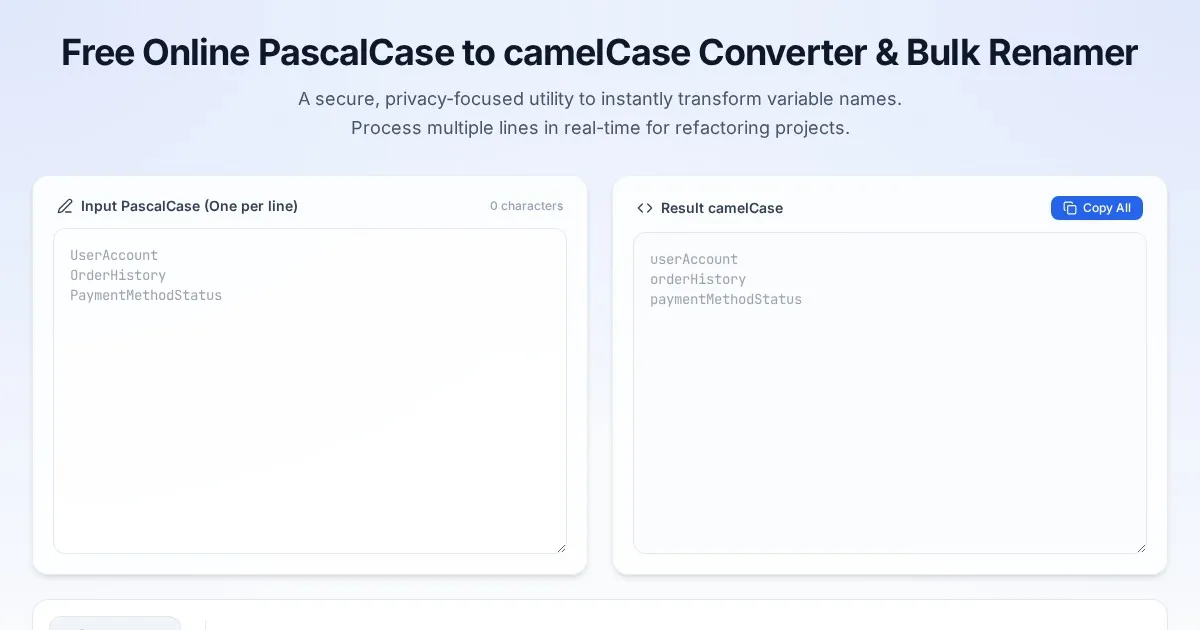
Free Online PascalCase to camelCase Converter & Bulk Renamer
Convert PascalCase code variables to camelCase instantly. A free, easy-to-use bulk variable renaming tool for developers. No server-side processing required.

Free Online Guitar Tablature Maker & Audio Player
Create, edit, and play your own guitar tablature arrangements with this free, interactive, browser-based guitar tab maker. No installation required.

Free CSS font-palette OpenType CPAL Color Font Configurator
Easily customize OpenType CPAL color fonts with this free web-based CSS font-palette generator. Configure, preview, and export CSS code for modern typography.
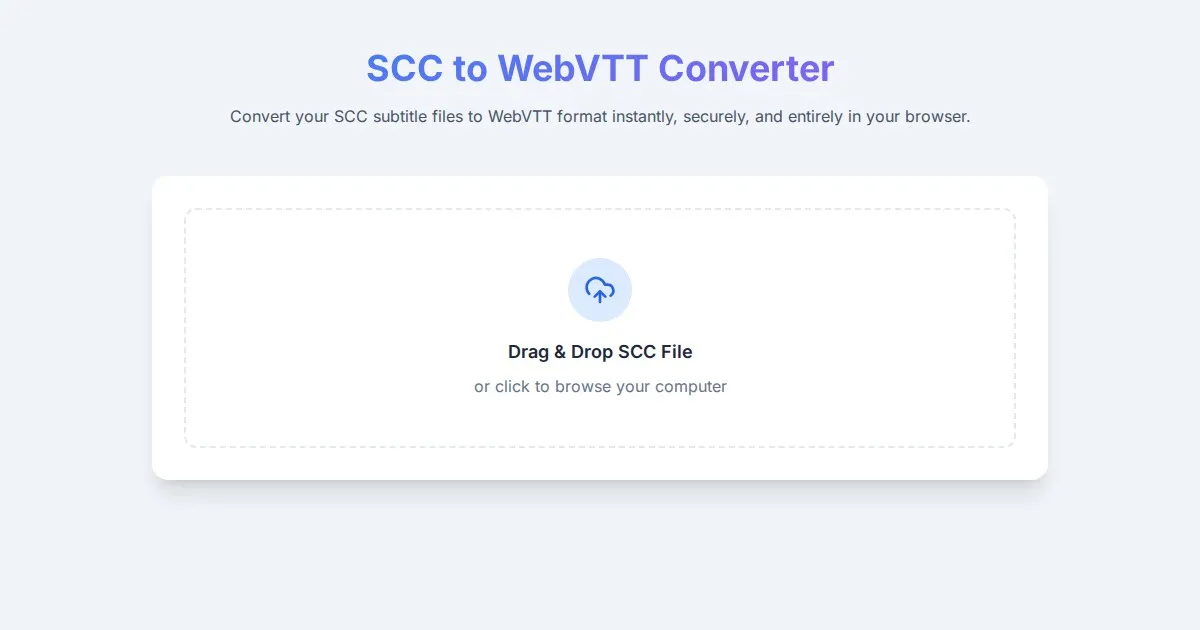
Free SCC to WebVTT Subtitle Converter Tool
Convert SCC subtitle files to WebVTT format online for free. Fast, secure, browser-based SCC to VTT conversion tool for video captioning and accessibility.
Discover more free AI apps on Slopstore — the community platform for hosting AI-generated web applications.