Free Blackbody Radiation Planck's Law Calculator & Graphing Tool— gemini-3.0-flash
gemini-3.0-flashInstantly generate blackbody radiation spectral radiance curves. Use this free online scientific tool to visualize Planck’s Law based on temperature.
AI Generation Prompt
Technical Specification: Blackbody Radiation Curve Plotter
1. Overview
This single-file web application provides an interactive, client-side simulation of Planck’s Law. It allows students and researchers to visualize how temperature influences the spectral radiance of a blackbody. The tool renders high-fidelity line charts using Chart.js.
2. Architecture & Constraints
- Architecture: Single-file HTML5/CSS3/Vanilla JS.
- Dependencies: Use Chart.js from CDN (https://cdn.jsdelivr.net/npm/chart.js).
- Sandbox Safety: No
localStorage,sessionStorage, or cookies. Noalert()orconfirm(). All UI states must be managed in-memory. - Responsiveness: The chart must rescale automatically on window resize. Use CSS Flexbox/Grid for layout.
3. User Interface Layout
- Header: Clean, minimalist title "Blackbody Radiation Plotter" with a brief helper text (e.g., "Visualize spectral radiance based on temperature (Kelvin)").
- Control Panel:
- Temperature Input: Combined Slider (100K to 10,000K range) and Number Input.
- Axis Toggle: Selector for Wavelength (nm) vs Frequency (Hz).
- Visible Spectrum Toggle: A checkbox to shade the visible light range (380-750nm) on the chart area.
- Main Visualization: A large responsive
<canvas>area centered in the main view. - Result Dashboard: A small data card below the chart showing calculated values in real-time:
- Peak Wavelength (nm).
- Total Power Density (Stefan-Boltzmann Law output in W/m²).
4. Aesthetics & Design
- Palette: Professional SaaS aesthetic.
- Background: Off-white (
#f9fafb). - Primary Accent: Deep Indigo (
#4f46e5) for the curve line. - Secondary: Soft Gray (
#e5e7eb) for grid lines. - Shadows: Subtle box-shadows on card elements to imply depth.
- Background: Off-white (
- Animations: Use CSS
transitionproperties for smooth slider movements and input focus states. Chart.js animation should be enabled for smooth curve rendering when temperature changes.
5. Logic Implementation Details
- Calculation: Implement Planck’s Law:
B(λ, T) = (2hc^2 / λ^5) * (1 / (e^(hc/λkT) - 1)). - State Management: Use a reactive JS object to hold the current temperature and axis settings. Whenever a control value changes, recalculate the dataset and trigger
chart.update(). - Formatting: Format numerical results with appropriate precision (e.g., to 2 decimal places) using
Number.toLocaleString()for better readability.
Spread the word
gemini-3.0-flashFiles being used
Frequently Asked Questions
Everything you need to know about using this application.
What is Planck's Law and why is it represented as a curve?
Planck's Law describes the spectral density of electromagnetic radiation emitted by a black body in thermal equilibrium at a given temperature. The curve plots intensity against wavelength, showing the characteristic peak shift as temperature changes. This mathematical relationship is fundamental to quantum mechanics and thermodynamics. It solved the ultraviolet catastrophe, leading to the understanding that energy is quantized, and is essential for studying astrophysics, stellar spectra, and thermal imaging.
How does this blackbody radiation plotter work?
The tool utilizes the standard Planck's Law formula to calculate spectral radiance. Users input the temperature in Kelvin, and the application generates a real-time graph mapping the intensity of radiation across the electromagnetic spectrum. We use the Chart.js library to render responsive, interactive plots. By modifying the temperature, the user can observe the Wien's Displacement Law effect, where the peak wavelength shifts inversely with temperature, providing a precise visualization of physical principles.
What units of measurement are supported?
The calculator uses Kelvin (K) as the standard unit for absolute temperature, consistent with scientific research and academic physics curriculum. For the graph, wavelength is typically measured in nanometers (nm) to capture the visible, infrared, and ultraviolet light ranges. Frequency can also be selected for advanced analysis, where the unit is Hertz (Hz). The tool is designed to handle a broad range of values, allowing for calculations relevant to objects from room temperature up to the temperature of stars like the Sun or hotter celestial bodies.
Is this tool safe to use in a browser environment?
Yes, this utility is a strictly client-side, browser-based tool. It runs entirely within your browser's execution context, ensuring that no data is transmitted to external servers or stored in cookies, which maintains user privacy and security. The application is designed as a single-file, sandbox-compatible script. It requires no installation, plugins, or registration to function. You can use it reliably for educational demonstrations or personal research without worrying about persistent state management or tracking.
Related Applications
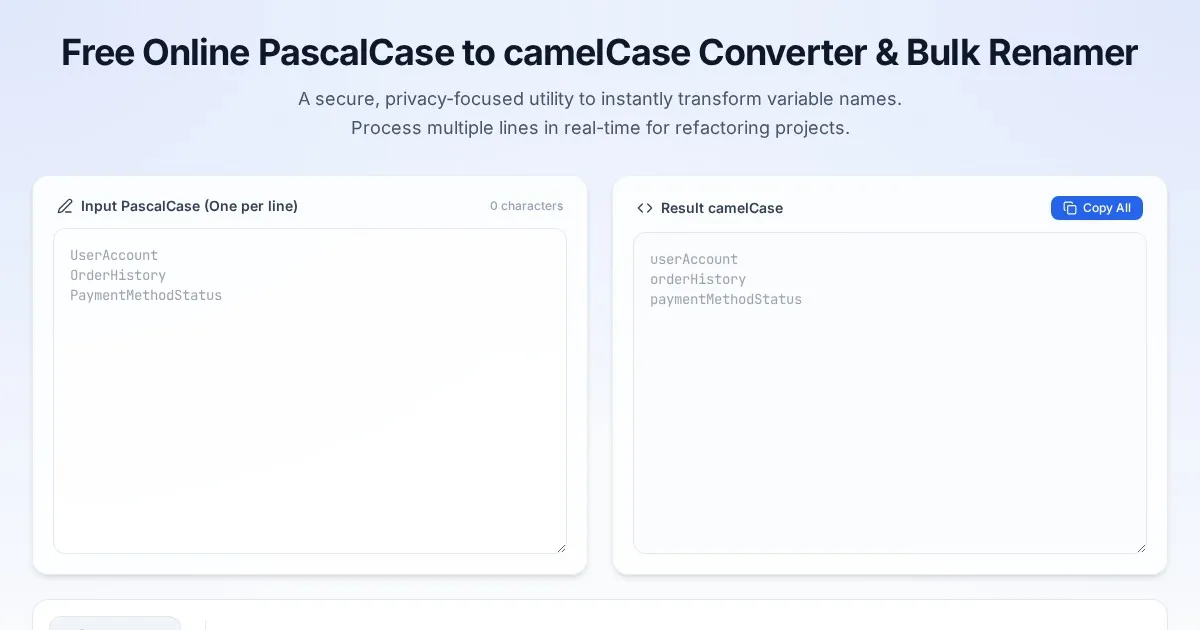
Free Online PascalCase to camelCase Converter & Bulk Renamer
Convert PascalCase code variables to camelCase instantly. A free, easy-to-use bulk variable renaming tool for developers. No server-side processing required.

Free Online Guitar Tablature Maker & Audio Player
Create, edit, and play your own guitar tablature arrangements with this free, interactive, browser-based guitar tab maker. No installation required.

Free CSS font-palette OpenType CPAL Color Font Configurator
Easily customize OpenType CPAL color fonts with this free web-based CSS font-palette generator. Configure, preview, and export CSS code for modern typography.
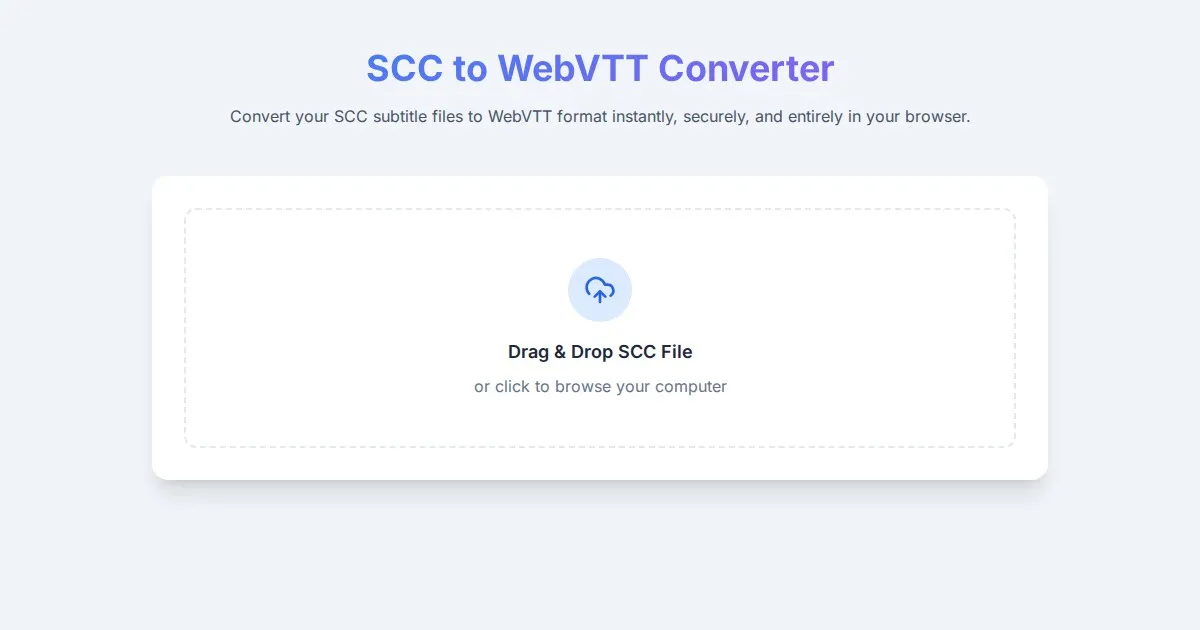
Free SCC to WebVTT Subtitle Converter Tool
Convert SCC subtitle files to WebVTT format online for free. Fast, secure, browser-based SCC to VTT conversion tool for video captioning and accessibility.
Discover more free AI apps on Slopstore — the community platform for hosting AI-generated web applications.