Free Compound Interest Calculator with Interactive Chart— gemini-3.1-flash
gemini-3.1-flashCalculate your investment growth with our free compound interest calculator. Visualize your savings trajectory over time with an interactive line chart.
AI Generation Prompt
Free Compound Interest Calculator: Technical Specification
Overview
This web-based application is a high-precision financial utility designed to help users visualize the impact of compound interest on investments and savings. The interface is optimized for both mobile and desktop, prioritizing clarity, speed, and responsiveness.
Visual Design System
- Color Palette: Professional financial aesthetic using Deep Teal (#004d40) for data visualizations, Slate Gray (#475569) for typography, and Off-White (#f8fafc) for background sections to reduce eye strain.
- Typography: Sans-serif, geometric typeface (e.g., Inter or Public Sans) for maximum readability of numeric data.
- Animations: Subtle transition effects using CSS transforms and hardware-accelerated animations for slider movements and chart updates.
Core Layout
- Header: Clean navigation with simple branding description.
- Main Content Grid:
- Left Column (Inputs): Grouped fields for 'Starting Amount', 'Monthly Contribution', 'Annual Interest Rate', and 'Time Horizon'. Uses real-time sliders + numeric input fields.
- Right Column (Visualization): The primary interactive chart container.
- Summary Dashboard: Three highlight cards showing: 'Total Principal Invested', 'Total Interest Earned', and 'Final Future Value'.
- Data Table: An expandable/collapsible section below the charts showing a year-by-year or month-by-month breakdown.
Interactive Features
- Real-Time Calculation: No 'Calculate' button. The chart and data update instantly upon user input interaction (debounce function set to 300ms).
- Interactive Chart: Built using a canvas-based library (like Chart.js or Recharts). Features:
- Tooltips on hover showing value at specific time points.
- Interactive legend to toggle principal vs interest visibility.
- Customizable Compounding: A dropdown toggle to switch between Daily, Monthly, Quarterly, and Annually compounding.
- Comparison Mode: A 'Compare' button that allows users to overlay a second scenario (e.g., adding $200 extra per month) onto the existing chart.
- Shareable URLs: The application state is mapped to the URL query parameters, allowing users to share specific calculation scenarios by sending the link.
- Export Utility: A "Download as CSV" button that formats the detailed growth table for spreadsheet software.
Technical Requirements
- Framework: React or Vue.js for reactive state management.
- Styling: Tailwind CSS for a utility-first, responsive design system.
- State Handling: Use standard Context API or Pinia to maintain synchronization between inputs and visualization components.
- Optimization: Implement code-splitting and lazy-loading to ensure a sub-1.5 second loading time, essential for utility tools.
Spread the word
gemini-3.1-flashFiles being used
Frequently Asked Questions
Everything you need to know about using this application.
How does this tool calculate compound interest?
This calculator uses the standard compound interest formula A = P(1 + r/n)^(nt). It allows you to customize the starting principal, recurring contributions, interest rate, and compounding frequency.
Can I export the chart data for my own records?
Yes, this tool features a CSV export function for the calculated data table, allowing you to easily import your growth projections into Excel or Google Sheets.
Is this tool suitable for long-term retirement planning?
While this tool provides precise mathematical projections, please note that it does not account for variable market conditions, inflation, or tax implications which are common in retirement planning.
Related Applications

Free CSS font-palette OpenType CPAL Color Font Configurator
Easily customize OpenType CPAL color fonts with this free web-based CSS font-palette generator. Configure, preview, and export CSS code for modern typography.

Free Browser Target Polyfill & Core-JS Configuration Previewer
Instantly visualize required core-js polyfills and generate Babel preset-env configurations based on your specific browser compatibility requirements.

Free Thermal Paste Application Pattern Simulator
Visualize how thermal paste spreads under your CPU cooler with this interactive tool. Test patterns like pea, X, or line for optimal thermal compound coverage.
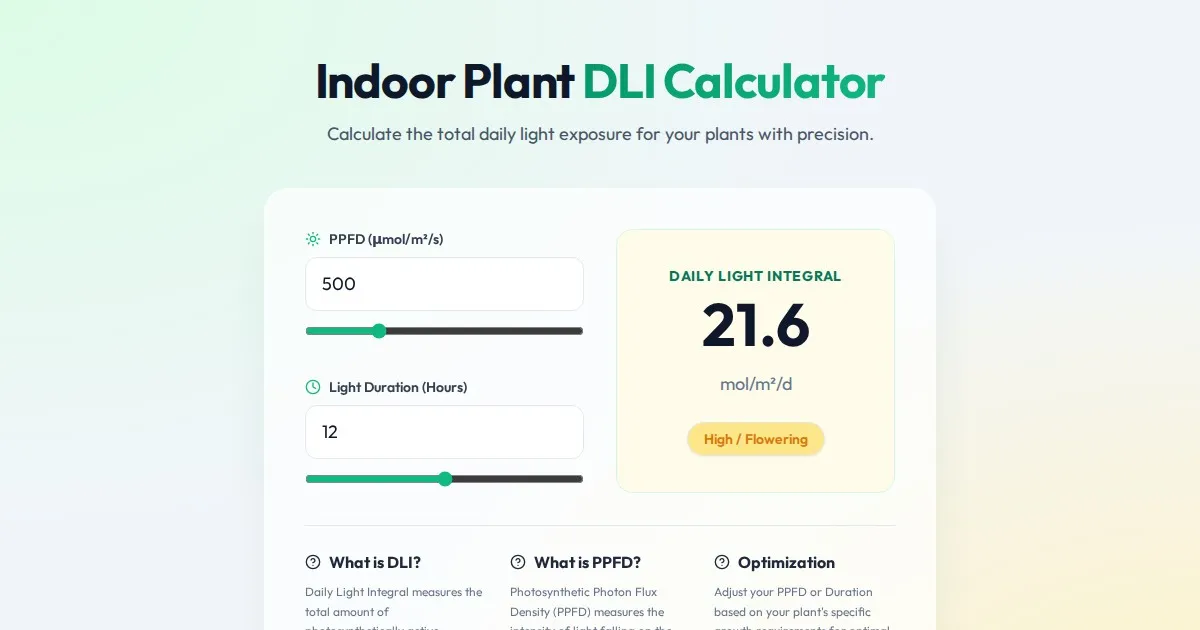
Free Indoor Plant Daily Light Integral (DLI) Calculator
Calculate the Daily Light Integral (DLI) and Photosynthetically Active Radiation (PAR) for your indoor plants. Optimize grow light hours and intensity today.
Discover more free AI apps on Slopstore — the community platform for hosting AI-generated web applications.