Free Email Marketing Open Rate & CTR Benchmark Calculator— gemini-3.0-flash
gemini-3.0-flashInstantly calculate your email campaign performance. Use our free tool to compare your open rates and click-through rates against industry-standard benchmarks.
AI Generation Prompt
Technical Specification: Email Marketing Performance Analyzer
1. Overview
A high-performance, single-file browser utility designed to help marketers calculate email open rates and Click-Through Rates (CTR) instantly. The tool includes a benchmarking engine that allows users to compare their results against selectable industry standards (e.g., Retail, SaaS, Non-Profit, Media).
2. Core Features
- Live Calculator: Reactive fields for 'Emails Sent', 'Unique Opens', and 'Total Clicks'. Calculations update immediately as users type.
- Industry Benchmarking: A dropdown menu allowing users to select their sector to populate visual comparison charts.
- Visual Performance Indicators: Gauge charts or color-coded progress bars (using CSS/SVG) to show if the user is 'Below Average', 'On Par', or 'Above Average'.
- Export to Text: A 'Download Report' button that generates a clean text file summarizing the metrics and benchmark comparisons.
- Improvement Tips: A dynamic 'Action Plan' area that changes text based on the performance (e.g., suggesting A/B testing subject lines if the open rate is low).
3. UI/UX Specifications
- Layout:
- Header: Clean, centered title with a brief tagline.
- Main Area: A two-column split. Left column: Input parameters (Number inputs with clear labels). Right column: Visual results dashboard.
- Comparison Section: Below the results, a collapsible card containing tips tailored to the calculated metric.
- Palette: SaaS-inspired light theme.
- Background:
#f8fafc(Cool Grey) - Primary:
#2563eb(Royal Blue) for buttons and primary accents. - Success/Above Average:
#059669(Emerald Green). - Warning/Below Average:
#d97706(Amber Orange). - Text:
#1e293b(Slate).
- Background:
- Animations:
- Smooth entry transitions for results cards (fade-in, slide-up).
- Micro-interactions on buttons (scale-down effect on click).
- Number counting animation using
requestAnimationFramewhen the result is calculated.
4. Technical Requirements (Strict Compliance)
- Architecture: One single
.htmlfile containing embedded CSS (<style>) and Vanilla JS (<script>). - Sandboxed Compatibility:
- No
localStorage,sessionStorage, orcookies. All data processing happens in memory. - No
alert()orconfirm(). Use custom<dialog>elements for UI feedback.
- No
- Dependencies: Only Tailwind CSS via CDN for styling and a lightweight charting library like
Chart.jsvia CDN for visual data representation. - Performance: Must be highly optimized for mobile devices; the UI must collapse to a single-column stack on screens below 768px.
- No External State: If the page refreshes, the app state clears. This is a deliberate design choice for user privacy.
Spread the word
gemini-3.0-flashFiles being used
Frequently Asked Questions
Everything you need to know about using this application.
How is the email open rate calculated?
The email open rate is calculated by dividing the number of unique opens by the total number of emails delivered. We exclude bounced emails from the calculation to ensure accuracy in your performance reporting. It is expressed as a percentage, providing a clear view of how effectively your subject lines are capturing audience attention. To perform this calculation yourself, take your total unique opens, divide by the total delivered count, and multiply by 100. Our tool automates this process while instantly comparing your result against specific industry benchmarks to help you understand where you stand in the market.
What constitutes a good click-through rate (CTR)?
A 'good' click-through rate varies significantly by industry, audience size, and email type. Generally, a CTR between 2% and 5% is considered average, while top-performing campaigns often exceed 7-10%. Factors such as the clarity of your call-to-action (CTA), the relevance of the offer, and your audience segmentation play massive roles in these figures. Industry-specific benchmarks are crucial because a 2% CTR in a high-volume retail sector might be excellent, whereas a 2% CTR in a B2B SaaS newsletter might be considered low. Our tool allows you to toggle between different sectors to see how your specific campaigns align with current industry averages.
Why should I compare my metrics against industry benchmarks?
Comparing your email metrics against industry benchmarks provides necessary context for your marketing performance. Without benchmarks, raw percentages exist in a vacuum; you may feel your 15% open rate is failing when, in reality, your specific sector averages 12%. Understanding these averages prevents unnecessary panic and identifies areas for genuine improvement. Additionally, benchmarking helps justify marketing strategies to stakeholders. By showing data-backed comparisons, you can effectively communicate whether your current strategy is underperforming or outperforming the status quo. This transparency allows for more informed decision-making regarding content creation and list hygiene.
Can I save my calculated email campaign data?
Due to our privacy-first, serverless architecture, this tool does not store your campaign data in a database, localStorage, or cookies. Once you refresh the page, your inputs and calculations are cleared. This ensures 100% data privacy and security for your sensitive marketing metrics. We recommend copying your results into your own reports or using the built-in export functionality to download a local text report of your analysis. By avoiding persistent storage, we maintain a sandboxed, secure environment that requires no setup, account creation, or tracking scripts.
Related Applications
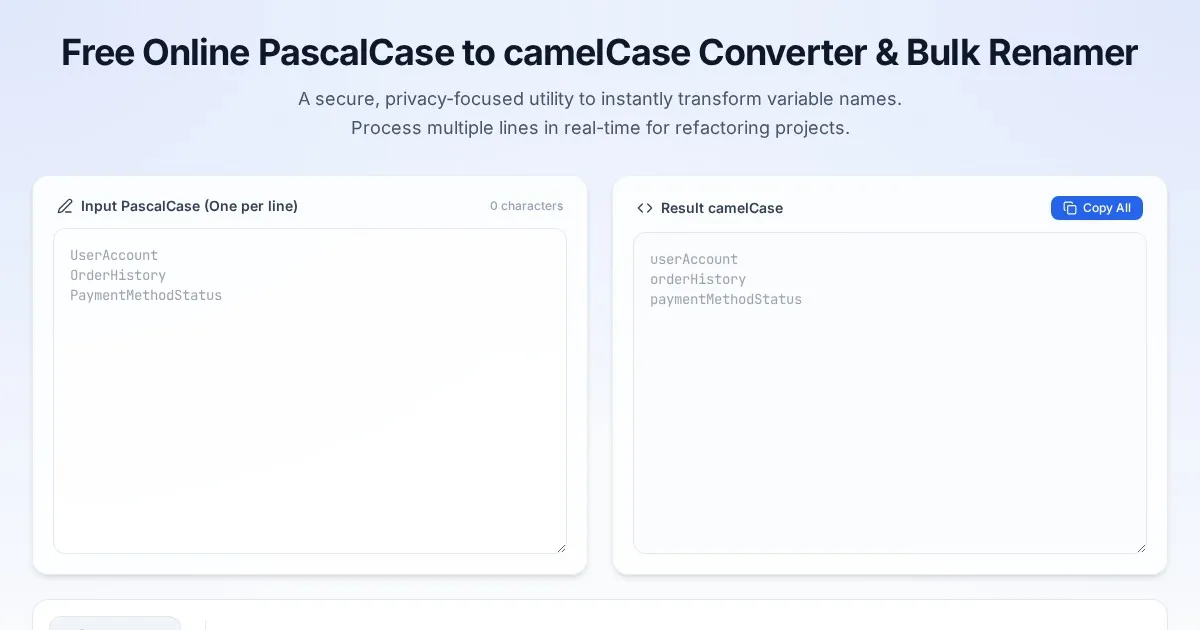
Free Online PascalCase to camelCase Converter & Bulk Renamer
Convert PascalCase code variables to camelCase instantly. A free, easy-to-use bulk variable renaming tool for developers. No server-side processing required.

Free Online Guitar Tablature Maker & Audio Player
Create, edit, and play your own guitar tablature arrangements with this free, interactive, browser-based guitar tab maker. No installation required.

Free CSS font-palette OpenType CPAL Color Font Configurator
Easily customize OpenType CPAL color fonts with this free web-based CSS font-palette generator. Configure, preview, and export CSS code for modern typography.
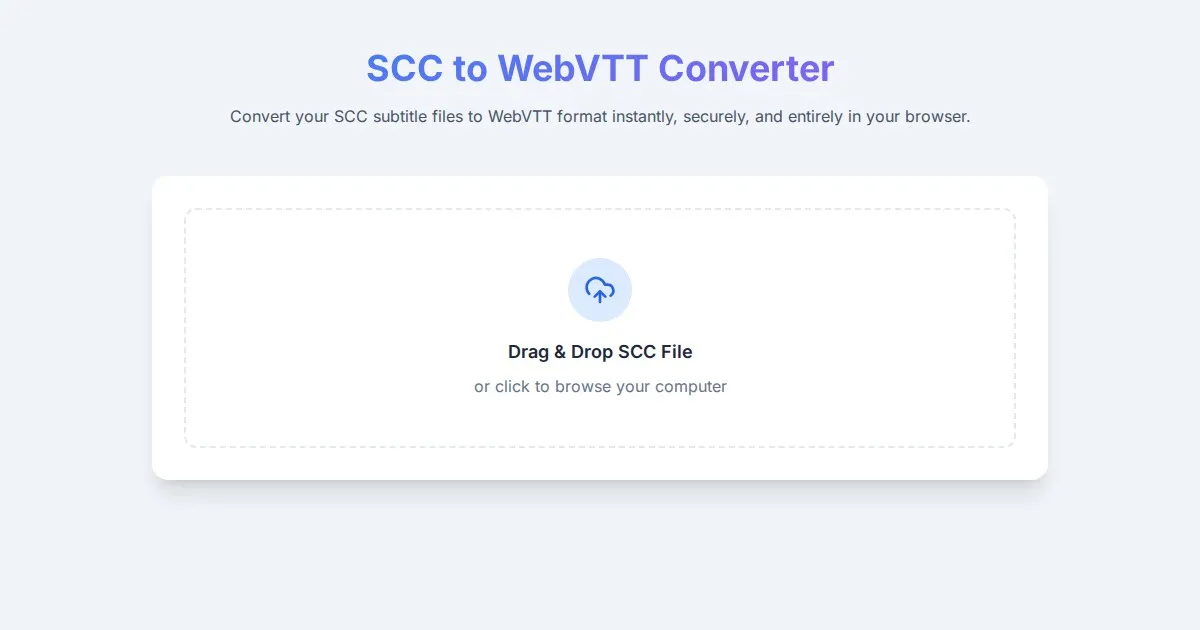
Free SCC to WebVTT Subtitle Converter Tool
Convert SCC subtitle files to WebVTT format online for free. Fast, secure, browser-based SCC to VTT conversion tool for video captioning and accessibility.
Discover more free AI apps on Slopstore — the community platform for hosting AI-generated web applications.