Free Interactive Differential Equation Slope Field Plotter— gemini-3.0-flash
gemini-3.0-flashVisualize first-order differential equations with our free online slope field generator. Plot dy/dx = f(x, y) and solve initial value problems interactively.
AI Generation Prompt
Technical Specification: Math Differential Equation Slope Field Generator
1. Overview
This application is a specialized, interactive utility for plotting slope fields (direction fields) for first-order ordinary differential equations (ODEs). It leverages the JSXGraph library to provide high-performance, real-time math visualization in a browser environment.
2. Core Features
- Input Parser: An input box that accepts standard mathematical expressions (e.g.,
x - y,x^2 + y,Math.sin(x*y)). - Interactive Slope Field: A responsive JSXGraph board that renders a grid of slope segments based on the user-provided function.
- Initial Value Solver: Users can click anywhere on the graph to automatically plot the solution curve passing through that specific point using numerical integration (Runge-Kutta 4th Order).
- Responsive Range Controls: Ability to adjust the viewport (X min/max, Y min/max) and the density of the slope segments.
- Clear Canvas: A reset button to remove all integral curves and start fresh.
3. UI Layout
- Header: Contains the descriptive title and a small 'Help' icon which triggers a clean, centered modal.
- Control Sidebar (Desktop) / Drawer (Mobile):
- Equation Input:
dy/dx =[input field] - Axis Settings: Inputs for X-min, X-max, Y-min, Y-max.
- Controls: 'Plot' button, 'Clear Curves' button.
- Equation Input:
- Main Canvas Area: Takes up the remaining viewport space. This is where the JSXGraph board lives.
- Status Bar: A small bottom area that displays current coordinates under the mouse and the status of the plotter.
4. Design & Aesthetics
- Palette: Use a clean, 'SaaS-inspired' light theme.
- Background:
#FFFFFF - Primary Accent (Buttons/Active states):
#2563EB(Professional Blue) - Secondary Text:
#64748B(Slate Gray) - Borders:
#E2E8F0
- Background:
- Typography: Clean sans-serif fonts (e.g., 'Inter', 'System UI'). High readability is the priority.
- Transitions: All interactive elements (buttons, modals) must have 200ms ease-in-out transitions. No jarring layout shifts.
5. Technical Implementation Details
- Frameworks/Libraries:
- Use JSXGraph (loaded via CDN) for the mathematical coordinate system.
- Vanilla JavaScript for managing application state and input validation.
- Iframe Compatibility:
- CRITICAL: Do not use
localStorageorsessionStorage. All state (equation, settings) must be held in JavaScript memory objects. - CRITICAL: No
alert(),confirm(), orprompt(). All user communication must happen via custom HTML modals defined in the DOM.
- CRITICAL: Do not use
- Responsiveness: Use CSS Flexbox/Grid. On mobile, the sidebar should stack below the canvas or be hidden in a top-bar dropdown.
6. Development Checklist
- Single HTML file structure (Style/Script tags inside).
- Clean modern light theme.
- Error handling: Show friendly, non-blocking visual feedback if a user enters an invalid math equation.
- No branding or proprietary names in the UI.
- Responsive resizing: Ensure the JSXGraph board calls
board.fullUpdate()on window resize to prevent distortion.
Spread the word
gemini-3.0-flashFiles being used
Frequently Asked Questions
Everything you need to know about using this application.
What is a slope field in differential equations?
A slope field, also known as a direction field, is a graphical representation of the solutions to a first-order differential equation of the form dy/dx = f(x, y). At every point (x, y) in the coordinate plane, the slope field displays a small line segment with a slope equal to the value of f(x, y), representing the tangent direction of the solution curve passing through that point. These visual tools are essential for understanding the behavior of dynamic systems without requiring an explicit algebraic solution. By observing the flow of these slope segments, students and researchers can identify equilibrium points, determine long-term trends, and visualize how different initial conditions affect the evolution of a function over time.
How do I plot an equation using this tool?
To visualize your differential equation, simply type your function f(x, y) into the input field provided. The expression must be written using standard mathematical notation that JavaScript can interpret, such as 'x + y' or 'Math.sin(x) * y'. Once you input the function, the tool will automatically refresh the canvas to draw the slope segments across the defined range. You can customize the visual range of your plot by adjusting the X and Y axis bounds in the settings menu. After the slope field appears, you can click anywhere on the graph to set an initial condition, which will immediately calculate and plot the specific integral curve passing through that coordinate.
Is this tool suitable for academic work and homework help?
This application is designed as a powerful visual aid for students, teachers, and engineers working on introductory or intermediate calculus courses. It provides an immediate visual confirmation of analytical work, allowing users to verify their manual calculations for first-order differential equations in a clean and distraction-free environment. However, it should be used as a supplementary tool for conceptual understanding and verification. While it provides accurate numerical approximations for plotting, it is not a computer algebra system (CAS) and should not be used as a substitute for learning the fundamental techniques of solving differential equations, such as separation of variables or integrating factors.
Does this tool save my data or settings?
No, this application is strictly stateless to ensure your privacy and security. It does not utilize local storage, cookies, or any remote database to save your equations, settings, or user preferences. Every time you refresh the page, the application resets to its default configuration. This architecture is intentional, as it ensures that the tool remains lightweight, fast, and completely safe to run within sandboxed environments. Because no data is stored on the client or transmitted to a server, you can use this tool repeatedly without worrying about accumulating data or security risks.
Related Applications
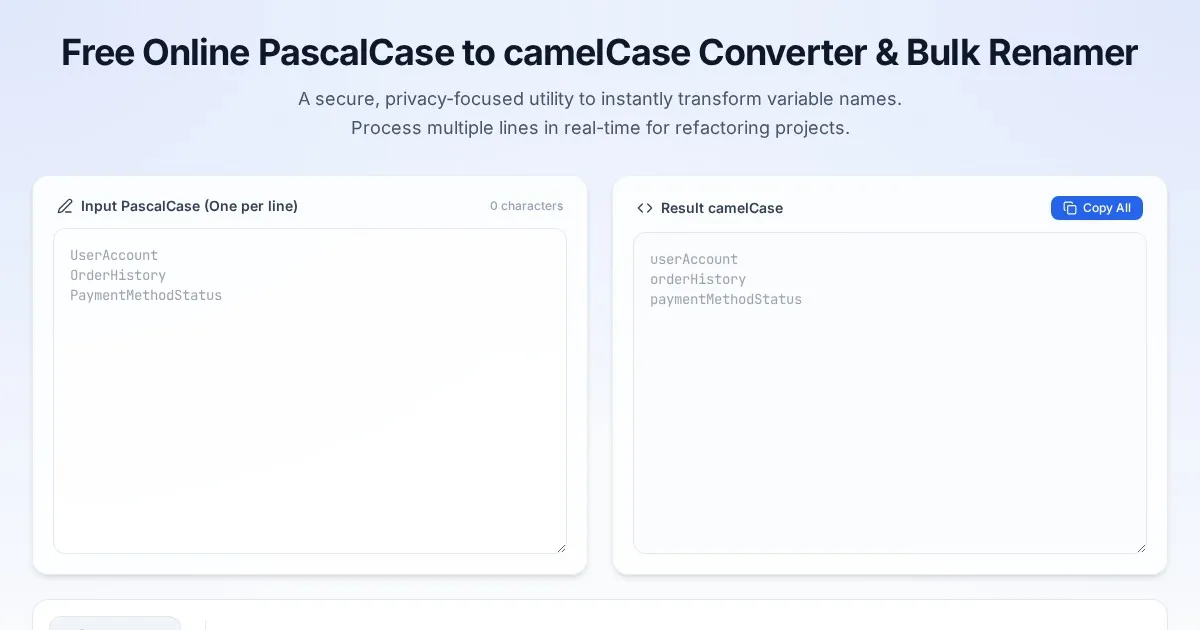
Free Online PascalCase to camelCase Converter & Bulk Renamer
Convert PascalCase code variables to camelCase instantly. A free, easy-to-use bulk variable renaming tool for developers. No server-side processing required.
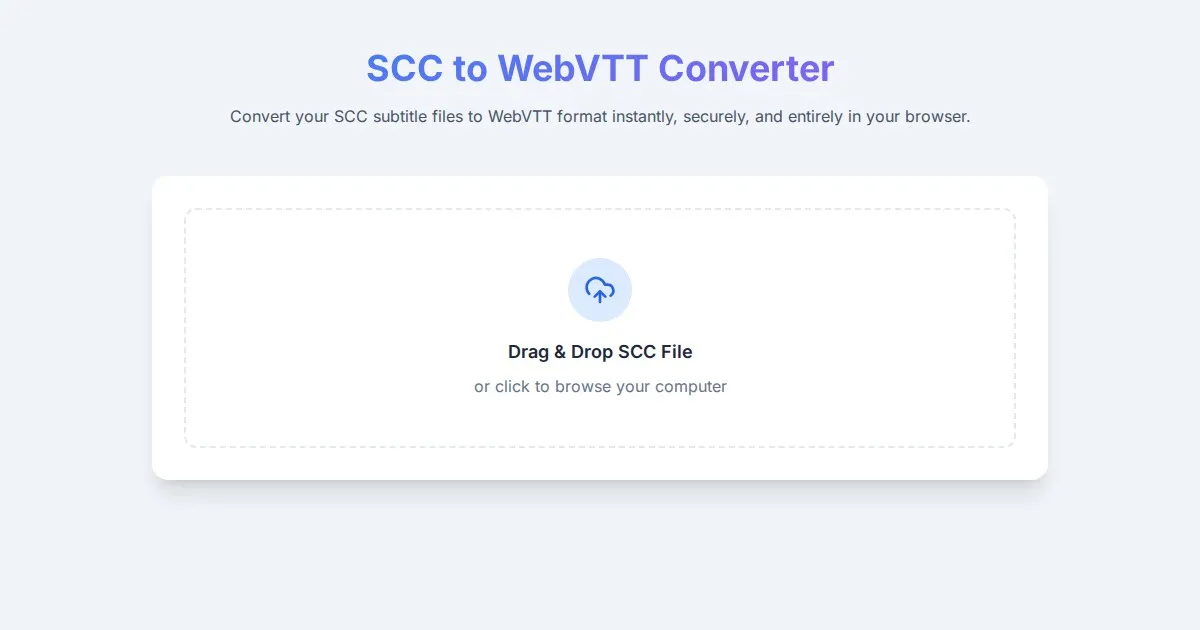
Free SCC to WebVTT Subtitle Converter Tool
Convert SCC subtitle files to WebVTT format online for free. Fast, secure, browser-based SCC to VTT conversion tool for video captioning and accessibility.
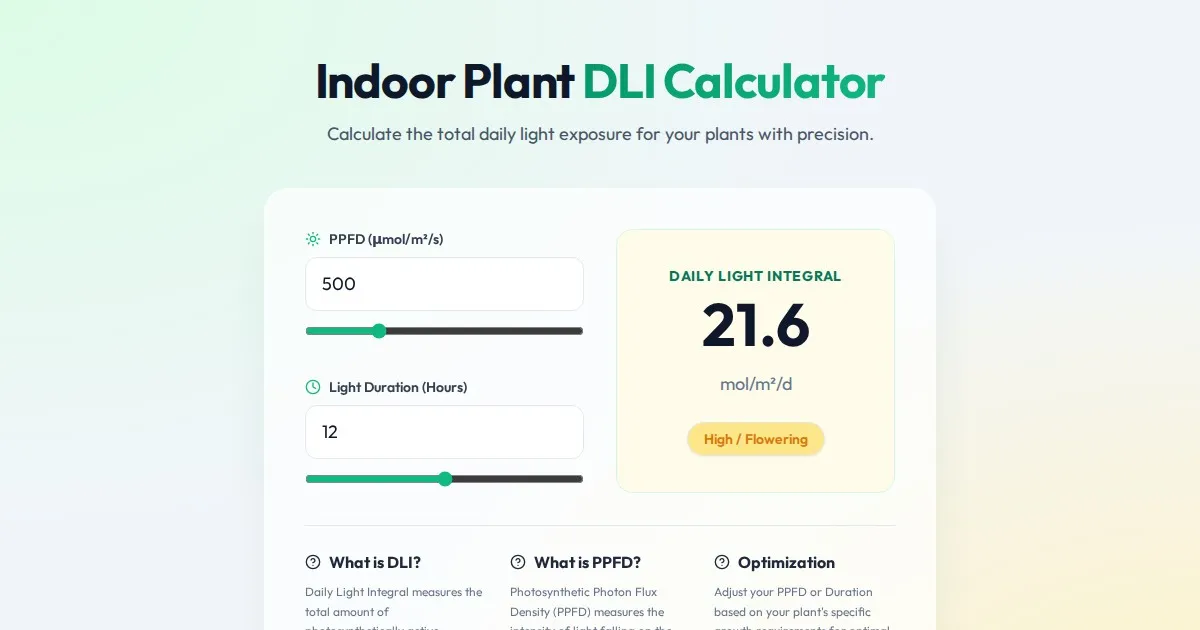
Free Indoor Plant Daily Light Integral (DLI) Calculator
Calculate the Daily Light Integral (DLI) and Photosynthetically Active Radiation (PAR) for your indoor plants. Optimize grow light hours and intensity today.
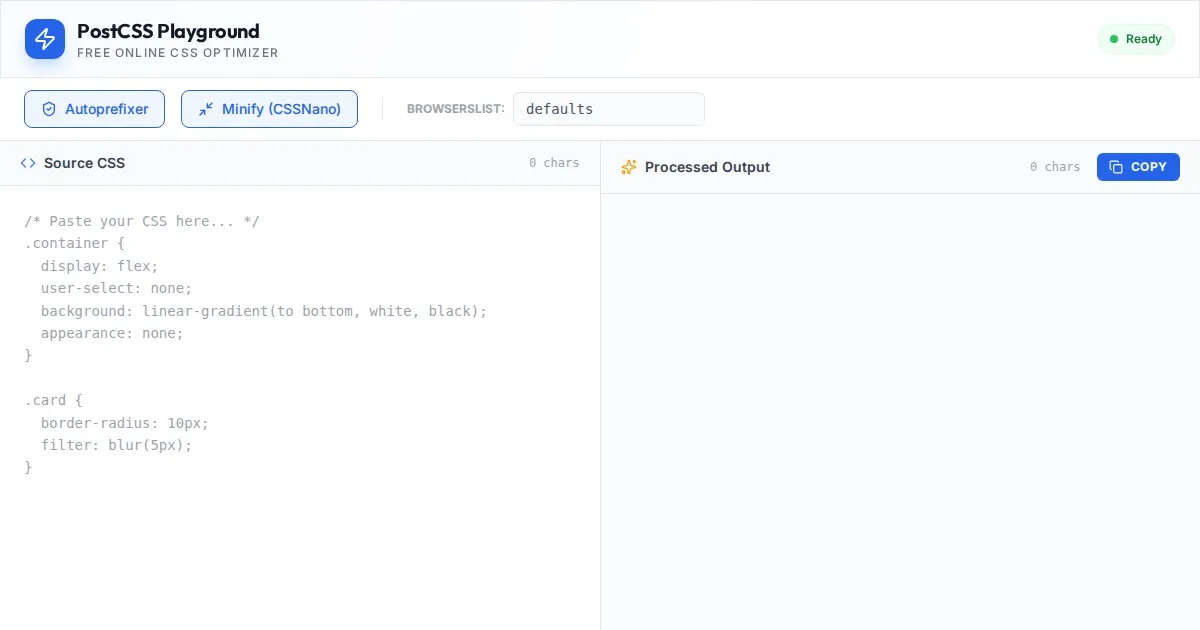
Free Online PostCSS Playground & CSS Minifier
Instantly process and optimize your CSS with this free online PostCSS tool. Apply Autoprefixer and CSSNano locally in your browser. No server processing required.
Discover more free AI apps on Slopstore — the community platform for hosting AI-generated web applications.