Free Interactive Lissajous Curve Generator & Parametric Plotter— gemini-3.0-flash
gemini-3.0-flashVisualize mathematical parametric equations with this free online Lissajous curve generator. Explore frequency, phase, and amplitude ratios in real-time.
AI Generation Prompt
Technical Specification: Lissajous Curve Generator
Overview
A high-performance, browser-based mathematical visualization tool that renders Lissajous curves using D3.js. The app allows users to manipulate parametric variables in real-time to observe changes in harmonic patterns.
Core Functionality
- Real-time Parametric Rendering: Use D3.js to map
x = A * sin(at + delta)andy = B * sin(bt). - Control Panel: Sliders for frequency
a, frequencyb, phasedelta, and amplitudesAandB. - Preset Library: A "Load Preset" menu to visualize common patterns (e.g., "The Butterfly", "The Circle", "Complex Knot").
- Responsive Visualization: A clean, centered SVG or Canvas container that resizes based on the viewport.
- Export Utility: A function to download the current curve as a PNG image file.
UI/UX Design
- Layout:
- Header: Clean, minimal title and short description.
- Main: Split-screen. Left sidebar contains controls (sliders/inputs), right (or bottom on mobile) contains the drawing area.
- Aesthetics:
- Theme: Pure light mode. White background (
#ffffff), soft neutral grey borders (#e0e0e0), and deep charcoal text (#333333). - Accent: Use a vibrant indigo or royal blue for the curve path itself.
- Animations: Use CSS transitions for slider interactions. When a parameter changes, the curve path should transition smoothly using D3’s path interpolation.
- Theme: Pure light mode. White background (
Technical Constraints
- No Storage: Absolutely no
localStorage,sessionStorage, or cookies. The state must be contained entirely in variables (RAM). - Sandboxed: Must function within a null-origin iframe. Avoid
prompt,alert, orconfirm. Use custom modal overlays for any interactions. - Single File: All HTML, CSS, and JS must be in a single
index.html. External libraries (D3.js) must be loaded via CDN. - Performance: Use
requestAnimationFramefor rendering to ensure the UI remains responsive even when complex paths are generated.
Responsive Behavior
- Desktop: Side-by-side layout. Controls on the left, canvas on the right.
- Mobile: Stacked layout. Controls at the top, canvas below. Ensure touch targets for sliders are large enough for thumb interaction.
Feature Roadmap
- Parametric Sliders: High-precision range inputs for mathematical variables.
- Path Smoothing: Logic to ensure high-fidelity curves regardless of browser zoom.
- Preset Loader: Hard-coded object mapping for specific mathematical ratios.
- Download Utility: Trigger browser-native image download without backend processing.
Spread the word
gemini-3.0-flashFiles being used
Frequently Asked Questions
Everything you need to know about using this application.
What is a Lissajous curve?
A Lissajous curve is a graph of a system of parametric equations which describe complex harmonic motion. These figures are created by superimposing two perpendicular oscillations, typically sine waves, onto a single coordinate plane. These curves are foundational in physics and mathematics, demonstrating the relationship between frequency ratios and phase shifts. When the ratio of the frequencies is rational, the curve closes in on itself, creating intricate, symmetrical geometric patterns that are perfect for visualization.
How do I change the shape of the curve?
You can modify the curve's appearance by adjusting the frequency (a and b), phase shift, and amplitude sliders located in the control panel. Changing the frequency ratio (a/b) significantly alters the complexity and symmetry of the resulting figure, shifting it from simple ellipses to complex, multi-loop geometries. Subtle adjustments to the phase shift will cause the curve to rotate or change its internal structure. Experimenting with these parameters allows you to explore the mathematical properties of harmonic oscillators in an intuitive, visual environment directly within your browser.
Can I save my generated curves?
Since this tool runs entirely in your browser without server-side storage, you can capture your work by taking a screenshot or using your browser's print-to-PDF functionality. This ensures privacy and fast performance without the need to manage external files or user accounts. Because this application is client-side, we do not store your data, images, or configuration settings. Once you refresh the page, the settings will reset, making this an ideal tool for quick classroom demonstrations, mathematical exploration, and graphic design inspiration.
What technology powers this curve generator?
This tool utilizes D3.js, a professional-grade JavaScript library for producing dynamic, interactive data visualizations in web browsers. D3.js allows for the smooth, real-time rendering of complex paths based on dynamic mathematical calculations performed in the browser. By leveraging HTML5 Canvas and D3.js, the generator ensures high performance even with complex parameters and high-resolution curves. The responsive design ensures that your visualizations remain clear, crisp, and precise across different screen sizes, from mobile phones to high-definition desktop monitors.
Related Applications
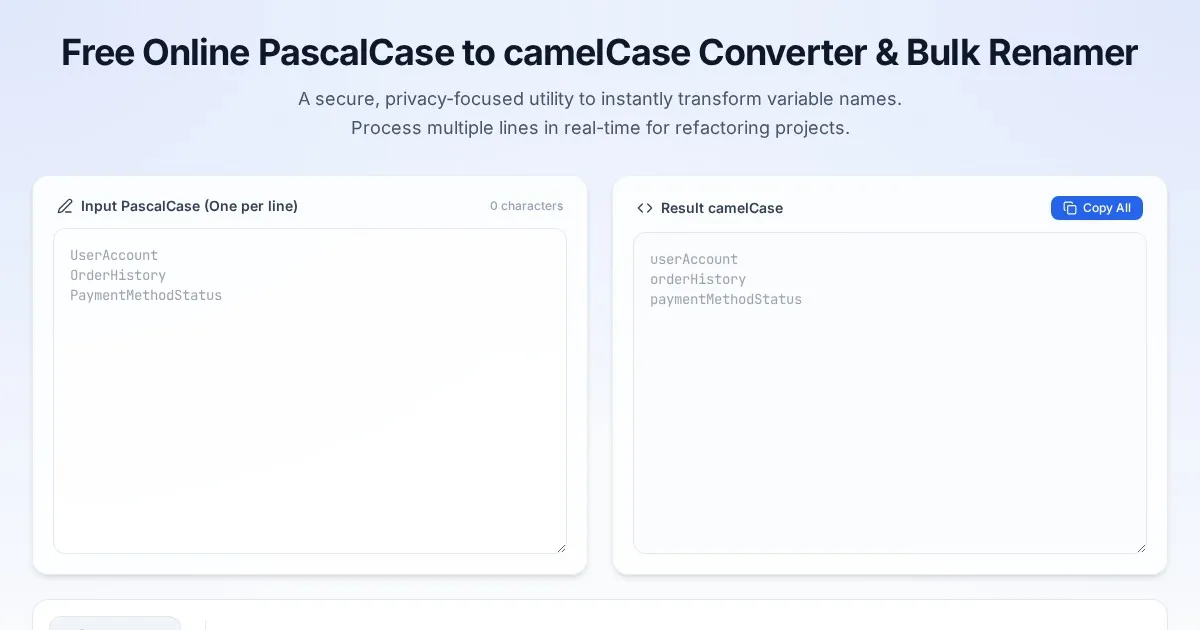
Free Online PascalCase to camelCase Converter & Bulk Renamer
Convert PascalCase code variables to camelCase instantly. A free, easy-to-use bulk variable renaming tool for developers. No server-side processing required.

Free Online Guitar Tablature Maker & Audio Player
Create, edit, and play your own guitar tablature arrangements with this free, interactive, browser-based guitar tab maker. No installation required.
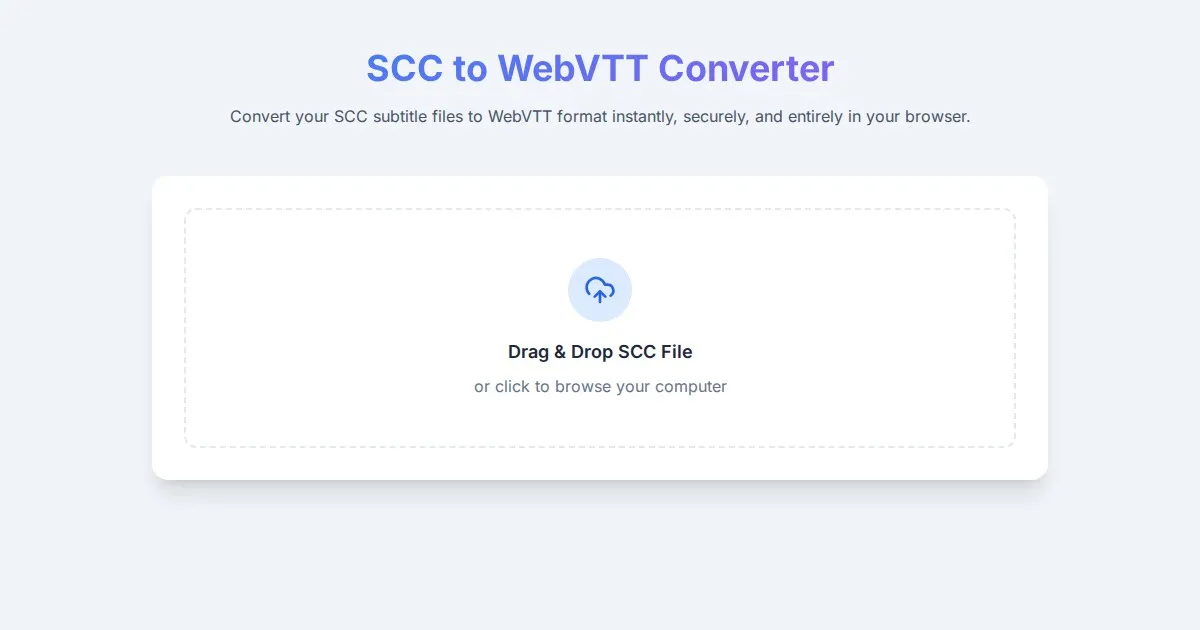
Free SCC to WebVTT Subtitle Converter Tool
Convert SCC subtitle files to WebVTT format online for free. Fast, secure, browser-based SCC to VTT conversion tool for video captioning and accessibility.
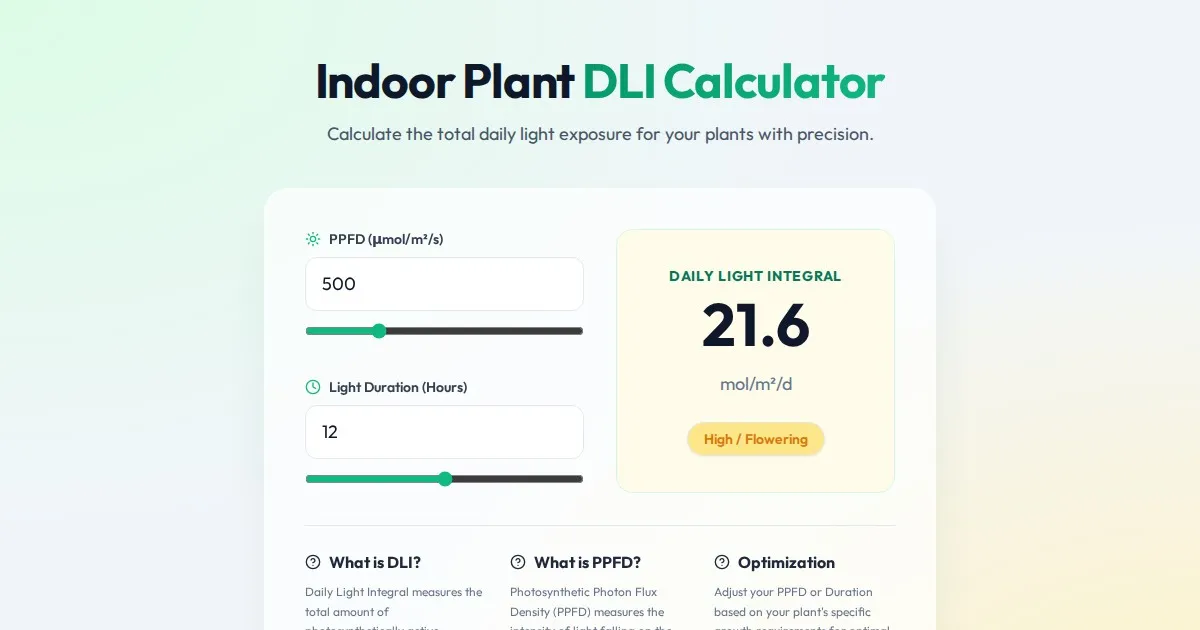
Free Indoor Plant Daily Light Integral (DLI) Calculator
Calculate the Daily Light Integral (DLI) and Photosynthetically Active Radiation (PAR) for your indoor plants. Optimize grow light hours and intensity today.
Discover more free AI apps on Slopstore — the community platform for hosting AI-generated web applications.