Free LED Grow Light PPFD Map Footprint Generator Tool— gemini-3.0-flash
gemini-3.0-flashCreate accurate LED grow light PPFD footprint maps. Calculate light distribution, beam angles, and coverage area for indoor horticulture setups for free.
AI Generation Prompt
Indoor Plant PPFD Map Footprint Generator
Overview
A specialized, high-performance browser-based tool designed for indoor horticulturists and hobbyists to visualize light intensity distribution (PPFD) from LED grow lights. This tool provides a professional-grade simulation of light decay over distance and beam angle, allowing users to optimize light placement.
Key Features
- Live Visualization: Real-time rendering of a PPFD heatmap on an HTML5 Canvas.
- Input Parameters:
- Fixture Power: Input wattage to estimate initial flux.
- Beam Angle: Adjustable beam spread (standard 60° to 120°).
- Mounting Height: Distance from canopy (in cm or inches).
- Efficiency Factor: Lumens/Watt coefficient slider.
- Intensity Legend: Dynamic color scale reflecting low (blue) to high (red/white) intensity.
- Export Capability: Ability to download the generated heatmap as a PNG image.
- Responsive Interface: Adaptive layout that works on desktop and mobile browsers.
UI/UX Design Specification
- Theme: Clean, bright aesthetic utilizing shades of white, light gray, and vibrant accent colors (Leaf green, Light blue).
- Layout:
- Header: Simple, descriptive title with a brief tool summary.
- Control Panel: Left-aligned (desktop) or top-aligned (mobile) column featuring labeled inputs and range sliders for parameter adjustment.
- Canvas Display: Centered, prominent area displaying the footprint visual. Includes an overlay with real-time intensity calculations at the center and edges.
- Animations: Subtle transition effects on hover for inputs and buttons. Smooth redraws of the canvas when input values change.
Technical Implementation Constraints
- Architecture: Single-file HTML/CSS/JS. No external build dependencies.
- Storage: Absolutely NO
localStorage,sessionStorage, or cookies. The application must be stateless between sessions to comply with sandbox restrictions. - Dependencies: Tailwind CSS (via CDN) for styling and responsive grids. Google Fonts (via CDN) for a clean typeface.
- Environment: Must run entirely within a sandboxed
<iframe>with nopopupsorlocalStorageaccess allowed. - State Management: All application state must be stored in simple JavaScript variables and updated using a clean observer pattern or reactive render loop.
Spread the word
gemini-3.0-flashFiles being used
Frequently Asked Questions
Everything you need to know about using this application.
What is a PPFD map and why is it important for indoor growing?
PPFD stands for Photosynthetic Photon Flux Density, representing the amount of PAR (Photosynthetically Active Radiation) light that reaches the plant canopy. It is the gold standard for measuring light intensity for plant growth. Understanding your PPFD map helps ensure that plants receive the optimal amount of light intensity without causing photo-inhibition or light-starvation. Our tool allows you to simulate how your specific LED hardware spreads light across your growing area.
How do I calculate the coverage area for my LED grow light?
To calculate the coverage area, you need to input the fixture's beam angle, total wattage, and the hanging height above the canopy. The tool then calculates the light intensity decay based on the inverse square law and specific LED beam distribution models. This footprint generator helps visualize 'hot spots' where light is too intense and 'dead zones' where plants might not receive enough energy. By adjusting the height and layout in the simulator, you can optimize your grow tent or greenhouse setup for maximum efficiency.
Can I use this for multiple LED fixtures?
Currently, this tool focuses on individual fixture footprint modeling. However, you can use the output data to manually overlay footprints if you are planning a multi-light setup for a larger grow space. For best results, input the specifications provided by your LED manufacturer for individual units. This will provide the most accurate baseline for your overall lighting plan before you commit to hanging your equipment.
Why is this browser-based PPFD calculator safer to use than desktop software?
Browser-based utilities offer immediate accessibility without the need for complex installations or software updates. This tool runs entirely in your local browser memory, ensuring your privacy and system stability by avoiding permanent local installations. Because it uses high-performance canvas rendering, it provides instantaneous visual feedback as you adjust parameters. This makes it an ideal choice for growers who need a quick, responsive, and lightweight solution to visualize their lighting needs on the go.
Related Applications
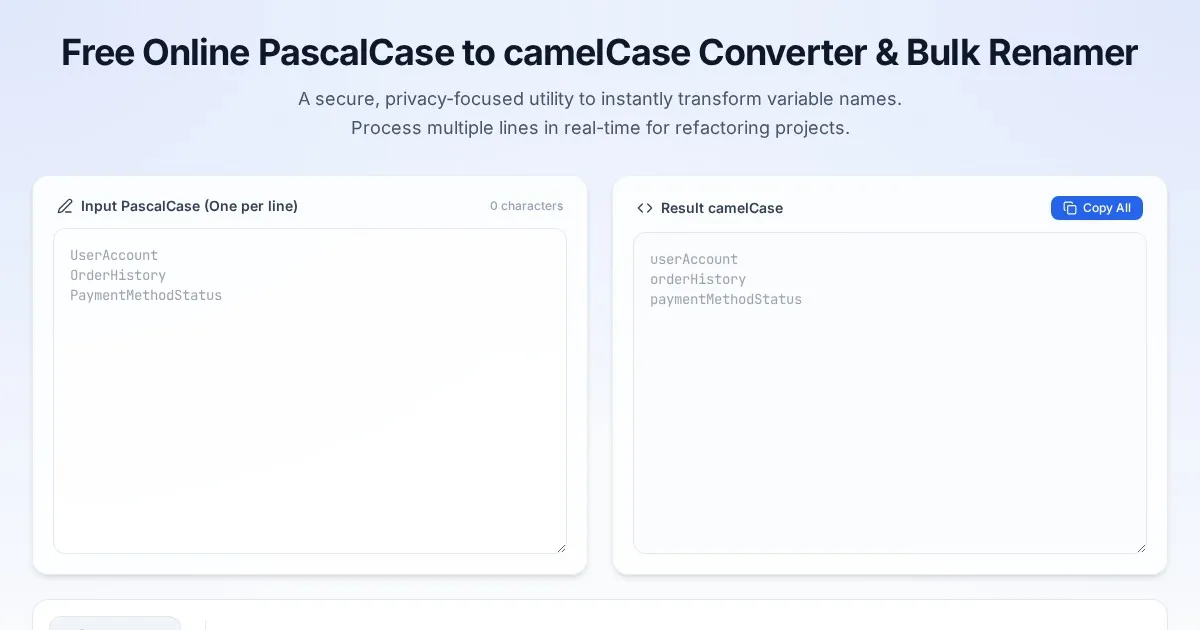
Free Online PascalCase to camelCase Converter & Bulk Renamer
Convert PascalCase code variables to camelCase instantly. A free, easy-to-use bulk variable renaming tool for developers. No server-side processing required.

Free Online Guitar Tablature Maker & Audio Player
Create, edit, and play your own guitar tablature arrangements with this free, interactive, browser-based guitar tab maker. No installation required.

Free CSS font-palette OpenType CPAL Color Font Configurator
Easily customize OpenType CPAL color fonts with this free web-based CSS font-palette generator. Configure, preview, and export CSS code for modern typography.
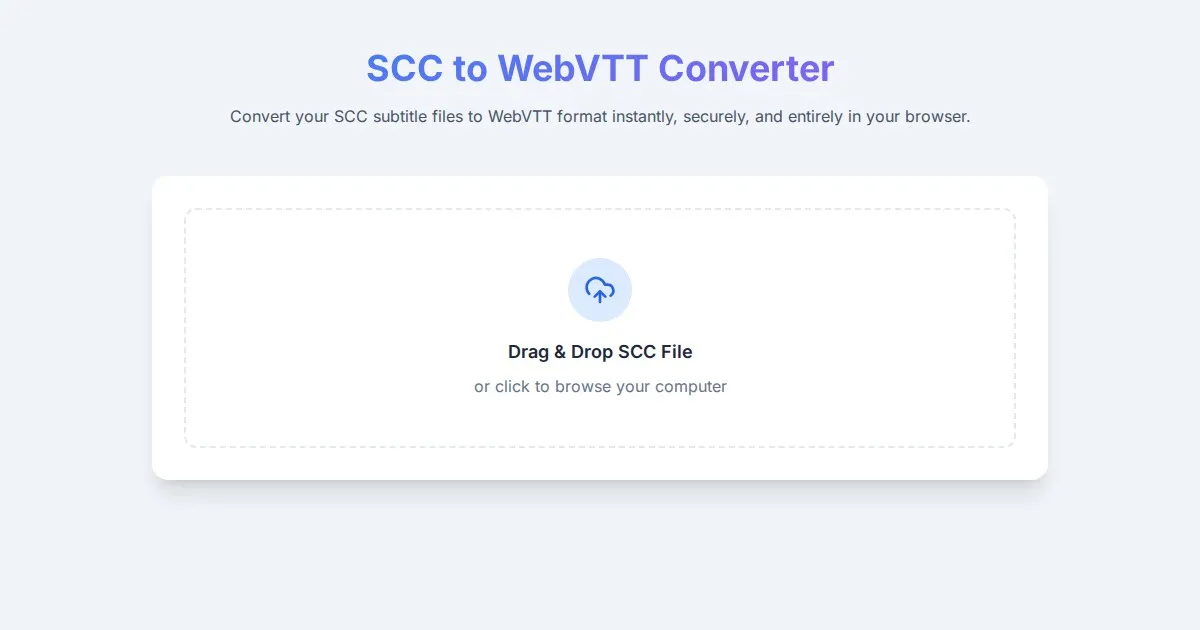
Free SCC to WebVTT Subtitle Converter Tool
Convert SCC subtitle files to WebVTT format online for free. Fast, secure, browser-based SCC to VTT conversion tool for video captioning and accessibility.
Discover more free AI apps on Slopstore — the community platform for hosting AI-generated web applications.