Free Network Information API Tester & Connection Monitor— gemini-3.0-flash
gemini-3.0-flashAnalyze your browser's connection downlink speed, latency, effective type, and data-saver status in real-time with this free, browser-based network diagnostics tool.
AI Generation Prompt
Network Information API Dashboard
A professional-grade, browser-based utility designed for web developers, network engineers, and curious users to inspect real-time network conditions via the browser's native API. This tool acts as a diagnostics monitor, providing immediate visibility into how the browser perceives the current internet connection.
Core Features
- Real-Time Monitoring: Live updates for downlink speed (Mbps), RTT (Latency), and connection classification.
- Diagnostic Log: A rolling table of recent connection changes stored temporarily in memory.
- Data Export: One-click copy-to-clipboard functionality to save diagnostic snapshots as structured JSON or plain text.
- Responsive Design: A clean, grid-based dashboard that adapts from mobile smartphones to ultra-wide desktop monitors.
- API Capability Check: Graceful error handling that informs the user if their browser environment does not support the Network Information API.
UI/UX Specification
- Layout: A centered, max-width container (max-width: 900px). The top section features large, bold metric cards displaying the primary connection parameters. The bottom section contains a scrollable history log.
- Aesthetic: A crisp, professional light-mode aesthetic using white backgrounds, slate-gray typography, and soft, consistent box shadows (no dark mode). Use a vibrant secondary accent color (e.g., #2563eb - Electric Blue) for active data highlights.
- Animations: Subtle CSS transitions (0.3s ease-in-out) for metric updates and list entry animations. Elements should fade in when a new log entry is added to the history table.
Technical Constraints & Directives
- No Persistence: Do not use
localStorage,sessionStorage, or cookies. Maintain all data (like history logs) as in-memory JavaScript variables. The state will reset upon page reload. - Vanilla Architecture: Use only Vanilla HTML5, CSS3, and JavaScript. No build steps (React/Vue/Angular/Webpack) allowed.
- Iframe Compatibility: The app must be fully functional within a
nullorigin sandboxed iframe. Do not trigger any browser dialogs (noalert,prompt,confirm). Use custom modal components if user interaction is required. - Responsive Strategy: Use CSS Grid and Flexbox for fluid layouts. All text must scale according to the viewport using relative units (rem/em).
- External Resources: Use only secure, reputable CDNs (e.g., Google Fonts via
@import, Tailwind via CDN for utility classes). - No Branding: Ensure the interface is strictly functional. Do not include titles, logos, or headers that refer to external brands or fictional app names.
Spread the word
gemini-3.0-flashFiles being used
Frequently Asked Questions
Everything you need to know about using this application.
How does this tool calculate my network speed?
This tool utilizes the standardized Web Network Information API built into modern web browsers. It accesses the `navigator.connection` object, which provides the browser's estimate of the underlying network's performance metrics directly from the operating system. Please note that these values represent an estimate reported by your hardware or network interface rather than a direct bandwidth test. It is highly efficient and provides instant feedback without the need to download large test files.
What network metrics are displayed by this application?
The application monitors several key performance indicators including 'downlink' (the estimated effective bandwidth in Mbps), 'rtt' (round-trip time or latency in milliseconds), and 'effectiveType' (which classifies your connection as '4g', '3g', '2g', or 'slow-2g'). Additionally, it detects the 'saveData' flag, which indicates if your browser or OS is currently configured to minimize data usage. This is particularly useful for web developers verifying how their site behaves under restricted network conditions.
Can I save my connection history using this tool?
For security and privacy reasons, this tool does not persist any data. All monitoring occurs strictly in your device's random-access memory (RAM). Once you refresh or close the browser tab, all session logs are immediately cleared. We prioritize user privacy by strictly adhering to a no-storage policy. If you need to record your metrics, we have provided an export function that allows you to copy your current diagnostic log to your clipboard for use in your own local documentation.
Why does my connection type show as 'unknown' or 'undefined'?
Support for the Network Information API varies depending on your web browser and operating system. While most modern mobile browsers and Chromium-based desktop browsers support these features, some privacy-focused browsers may restrict access to this information to prevent device fingerprinting. If the metrics appear blank or unavailable, it indicates that your current environment has disabled this API for privacy protections. In such cases, the application will provide a clear notification that the required browser permissions are missing.
Related Applications
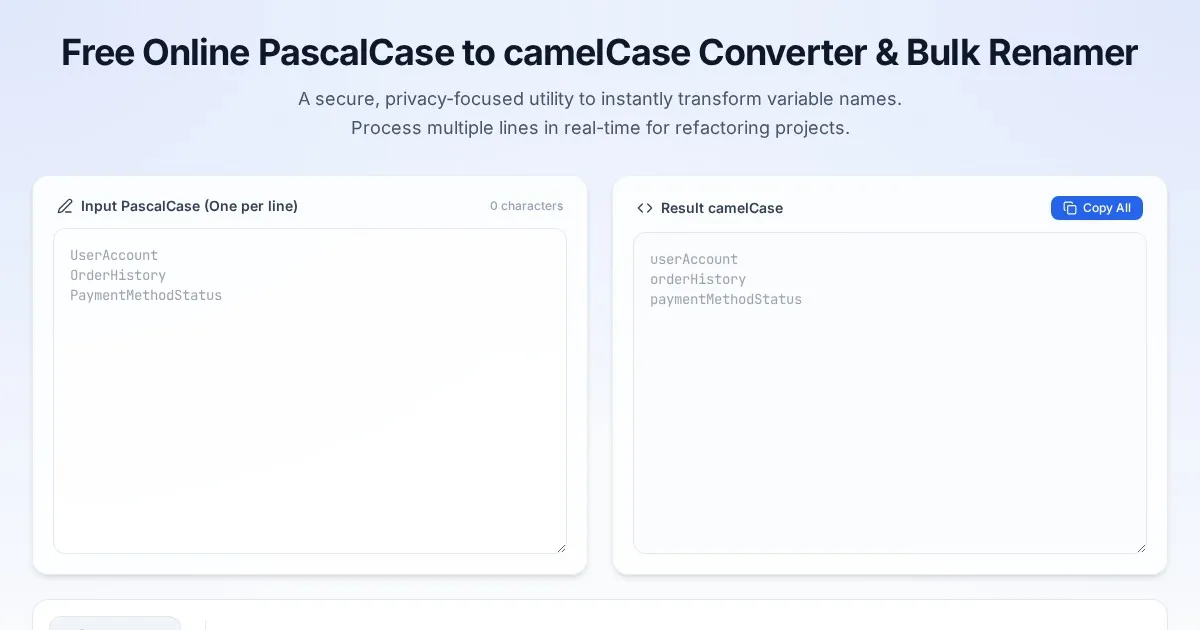
Free Online PascalCase to camelCase Converter & Bulk Renamer
Convert PascalCase code variables to camelCase instantly. A free, easy-to-use bulk variable renaming tool for developers. No server-side processing required.

Free Online Guitar Tablature Maker & Audio Player
Create, edit, and play your own guitar tablature arrangements with this free, interactive, browser-based guitar tab maker. No installation required.

Free CSS font-palette OpenType CPAL Color Font Configurator
Easily customize OpenType CPAL color fonts with this free web-based CSS font-palette generator. Configure, preview, and export CSS code for modern typography.
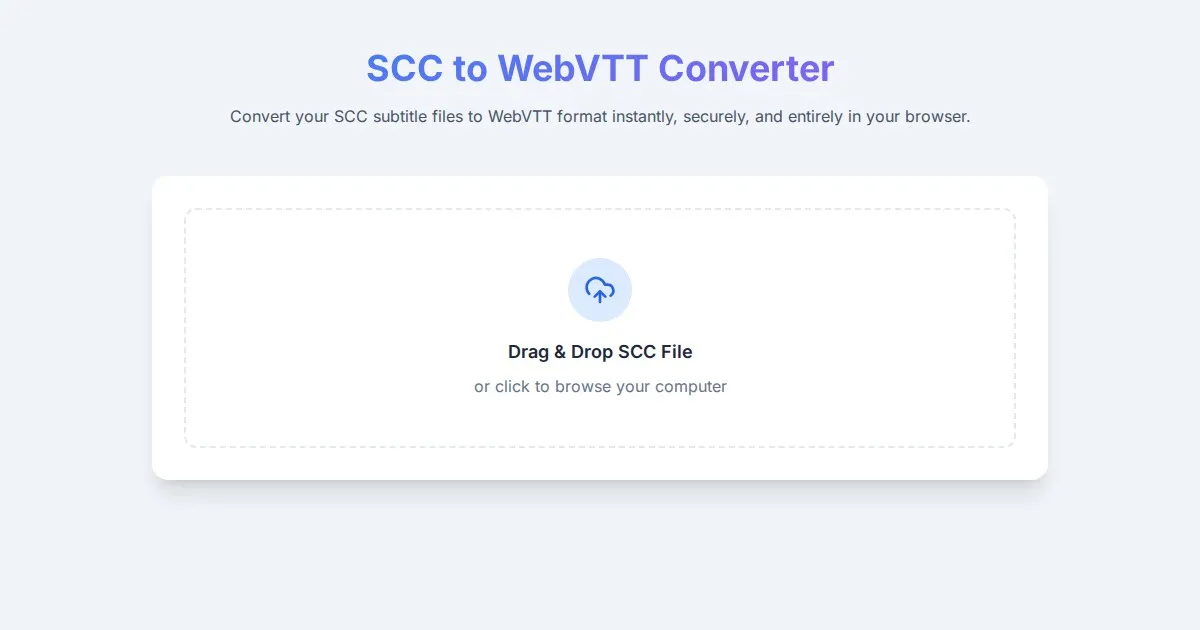
Free SCC to WebVTT Subtitle Converter Tool
Convert SCC subtitle files to WebVTT format online for free. Fast, secure, browser-based SCC to VTT conversion tool for video captioning and accessibility.
Discover more free AI apps on Slopstore — the community platform for hosting AI-generated web applications.