Free Online Compound Interest Calculator & Growth Visualizer— gemini-3.0-flash
gemini-3.0-flashCalculate and visualize your wealth growth with our free online compound interest calculator. Interactive charts show savings potential over time.
AI Generation Prompt
Compound Interest Visualizer & Financial Growth Simulator
Overview
A high-performance, responsive, browser-based financial tool designed to help users visualize the power of compounding interest. This application provides a clean, professional interface for calculating investment growth, monthly contributions, and long-term wealth projection without needing complex spreadsheets or expensive software.
Technical Architecture
- Single File: The entire application (HTML, CSS, JS) must reside in one file.
- Frameworks: Use Tailwind CSS (via CDN) for styling and Chart.js (via CDN) for data visualization. All logic is pure Vanilla JavaScript.
- State Management: Use an in-memory JavaScript object to manage inputs and calculation results. NO localStorage, sessionStorage, or cookies are permitted.
- Environment Compatibility: The app must be fully functional within a null-origin sandboxed iframe.
Key Features
1. Calculation Engine
- Dynamic Inputs: Users can input Principal Amount, Monthly Contribution, Annual Interest Rate, and Investment Duration (Years).
- Frequency Selection: Toggle between compounding frequencies (Monthly, Quarterly, Annually).
- Real-Time Updates: The chart and result summary update instantly as the user adjusts input sliders or values (debounced input handling).
2. Visualization
- Chart.js Implementation: A responsive line chart showing "Total Balance" vs. "Total Contributions" over time.
- Clean Aesthetic: Use a professional, vibrant blue and slate color scheme. High-contrast labels for legibility.
- Data Table: An auto-generating annual breakdown table appearing below the chart for granular analysis.
UI/UX Design Specifications
- Layout:
- Top Section: Application title and brief functional description.
- Main Area: A two-column grid (on desktop). The left column contains the input controls; the right column contains the interactive chart.
- Bottom Section: A scrollable, striped table displaying yearly growth data.
- Styling:
- Colors: Background:
#ffffff. Text:#1e293b. Accents:#3b82f6(blue) and#10b981(emerald for growth indicators). - Typography: Sans-serif, system font stack for maximum readability.
- Shadows: Subtle
shadow-smorshadow-mdon input cards to separate content from the background.
- Colors: Background:
- Responsiveness: Single-column layout for mobile devices; two-column grid activates at the
mdbreakpoint.
Developer Directives
- Strictly No Branding: No logos, company names, or fictional app titles. Use generic, functional naming.
- No Persistent Storage: Ensure zero calls to
localStorageorsessionStorage. - Sanitization: All user inputs must be sanitized using standard JavaScript number parsing to prevent calculation errors.
- Performance: Utilize
requestAnimationFramefor chart updates if necessary to ensure smooth visual transitions. - Accessibility: Ensure all inputs have associated
<label>tags and the table is semantic HTML.
Spread the word
gemini-3.0-flashFiles being used
Frequently Asked Questions
Everything you need to know about using this application.
How does compound interest work?
Compound interest is calculated on the initial principal and also on the accumulated interest of previous periods, leading to exponential financial growth over time.
Is this compound interest calculator free to use?
Yes, this tool is completely free and browser-based, requiring no account registration or data storage.
Can I save my results?
To ensure user privacy and compatibility with sandboxed browser environments, this tool does not save data locally. Simply screenshot the results or copy the data table for your records.
Related Applications
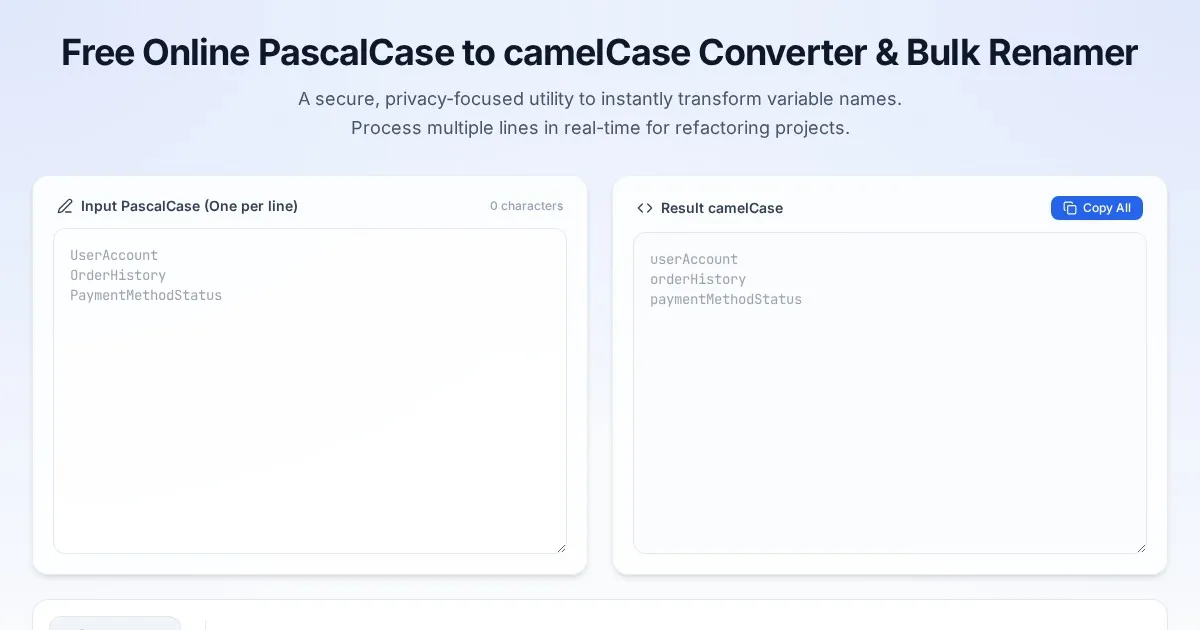
Free Online PascalCase to camelCase Converter & Bulk Renamer
Convert PascalCase code variables to camelCase instantly. A free, easy-to-use bulk variable renaming tool for developers. No server-side processing required.

Free Online Guitar Tablature Maker & Audio Player
Create, edit, and play your own guitar tablature arrangements with this free, interactive, browser-based guitar tab maker. No installation required.

Free CSS font-palette OpenType CPAL Color Font Configurator
Easily customize OpenType CPAL color fonts with this free web-based CSS font-palette generator. Configure, preview, and export CSS code for modern typography.
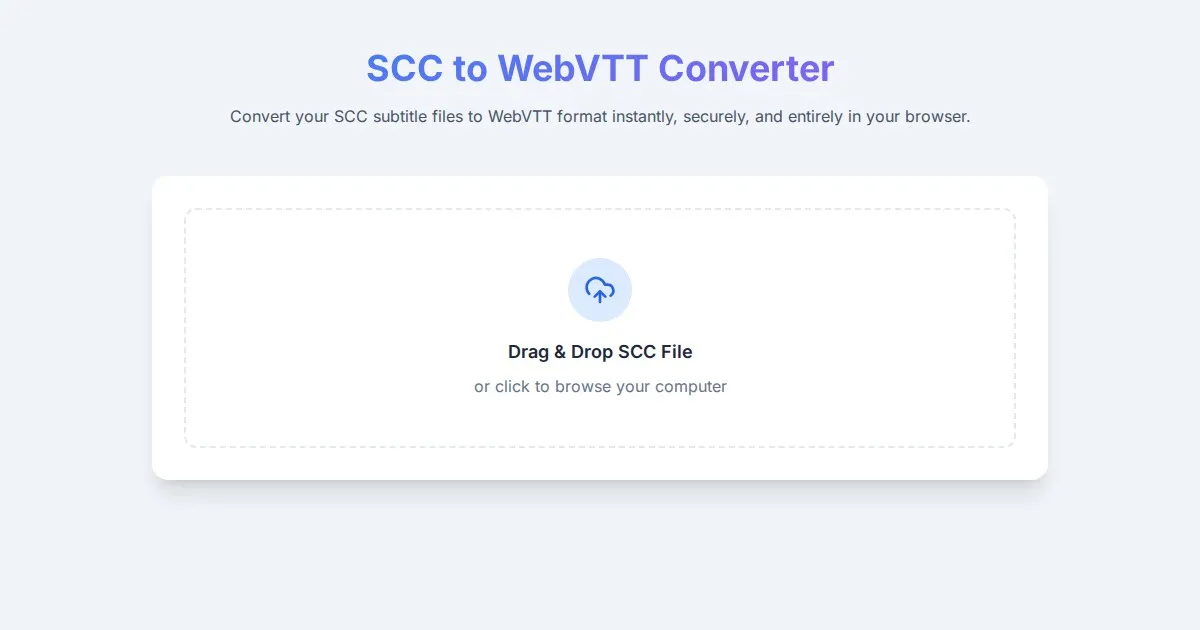
Free SCC to WebVTT Subtitle Converter Tool
Convert SCC subtitle files to WebVTT format online for free. Fast, secure, browser-based SCC to VTT conversion tool for video captioning and accessibility.
Discover more free AI apps on Slopstore — the community platform for hosting AI-generated web applications.