Free PPFD Heatmap & Grow Light Footprint Calculator— gemini-3.0-flash
gemini-3.0-flashCalculate and visualize PPFD footprints for indoor LED grow lights. Free, easy-to-use tool to map light intensity, distribution, and coverage for indoor plants.
AI Generation Prompt
Indoor Plant PPFD Heatmap & Grow Light Footprint Generator
Technical Overview
A lightweight, high-performance browser-based tool that calculates and renders a real-time PPFD (Photosynthetic Photon Flux Density) heatmap for indoor growers. It relies purely on client-side canvas rendering to visualize light intensity distribution without requiring back-end processing or local storage.
Core Features
- Live Heatmap Visualization: Real-time generation of a color-coded light intensity map (High intensity = warm colors, Low intensity = cool colors).
- Physics-Based Calculations: Uses the inverse-square law to simulate light fall-off based on hanging height, beam angle, and total output.
- Customizable Parameters:
- Light Intensity Input (μmol/s)
- Hanging Height (cm/inches)
- Beam Angle (degrees)
- Grow Area Dimensions (width/length)
- Interactive Legend: Hover over the heatmap to see estimated μmol/m²/s values at specific coordinates.
- Export Utility: One-click image download of the generated footprint map for record-keeping.
User Interface Layout
- Header: Clean, minimalist title area with a brief usage instruction toggle.
- Sidebar (Control Panel): Stacked vertical input fields with high-quality sliders and numerical inputs for precise control.
- Main Display Area: Large, responsive HTML5 Canvas element centered in the view, rendering the heatmap. Below the map, a color-coded legend displays the range of light intensity.
- Footer/Bottom Section: Simple 'Download Map' button and 'Reset' button. No persistent footers are present.
Design System & Aesthetics
- Color Palette: Professional SaaS aesthetic using soft, bright tones.
- Primary: Sage Green (#2D6A4F) for action buttons.
- Background: Off-white (#F8F9FA) for the main canvas area.
- Surface: Pure White (#FFFFFF) for control cards with soft, diffused box-shadows.
- Text: Slate Grey (#343A40) for readability.
- Typography: Sans-serif, geometric font (e.g., Inter or system-ui) for clarity.
- Animations: Subtle transitions for slider movement and canvas redraws. No jarring movements; use
transition: all 0.2s easefor UI elements.
Developer Directives
- Architecture: Single HTML5 file containing all CSS (within
<style>) and JavaScript (within<script>). - Zero Storage: Strictly adhere to the constraint of NO
localStorage,sessionStorage, or cookies. Use local JS objects to manage state. - Responsiveness: Use Flexbox/Grid for the layout. Ensure the canvas remains responsive (aspect-ratio preserved) on mobile devices using
max-width: 100%. - Iframe Security: Ensure no code attempts to access
window.toporwindow.parent. All operations must be scoped to the iframe content. - Dependencies: CDN-based Tailwind CSS for styling and potentially
html2canvasfor the image export feature. - Performance: Efficiently redraw the canvas only when input values change using a
requestAnimationFrameloop or debounce-heavy event listeners.
Spread the word
gemini-3.0-flashFiles being used
Frequently Asked Questions
Everything you need to know about using this application.
What is PPFD and why does it matter for my indoor plants?
PPFD stands for Photosynthetic Photon Flux Density, measuring the amount of photosynthetically active photons that actually hit a square meter of your plant canopy every second. Unlike total light output, PPFD tells you exactly how much 'fuel' your plants are receiving for photosynthesis at specific locations. Optimizing PPFD is critical for indoor growing because different plant species have specific light requirements. Providing too little results in stunted, leggy growth, while excessive PPFD can cause light stress, bleaching, or tissue damage, effectively wasting your electricity and potentially harming the health of your indoor garden.
How does this PPFD footprint calculator help with grow light placement?
This calculator allows you to visualize how your light's intensity disperses over your grow area based on height and beam angle. By inputting your light's specifications, the tool generates a spatial heatmap showing where intensity is highest and where it tapers off toward the edges of your tent or grow room. Using this information, you can adjust the hanging height of your LED fixtures to achieve uniform coverage. It helps you avoid 'hot spots' directly under the light and ensures that plants at the periphery receive enough light, leading to more consistent growth rates across your entire cultivation footprint.
Does this tool require external storage or account creation?
No, this application is a completely private, single-file browser utility. It does not utilize cookies, localStorage, or any form of external database to track your data or settings, ensuring your privacy and session anonymity at all times. All calculations and heatmap renderings occur in-memory within your browser. Because it runs locally, you do not need to worry about account registration, data security, or third-party tracking; simply open the file, use the sliders to map your light, and clear the data by refreshing the page when you are done.
Is this tool suitable for all types of LED grow lights?
This tool is designed as an estimation aid for standard LED grow lights with documented beam angles. It provides a visual approximation of light distribution patterns based on inverse-square law physics, helping you understand how intensity changes with distance from the light source. While highly useful for planning your setup, keep in mind that real-world PPFD values can vary based on individual lens optics, reflective surfaces in your grow space, and diode efficiency. Always verify your setup with a dedicated quantum sensor or PAR meter if precise, commercial-grade measurements are required for your specific plant varieties.
Related Applications
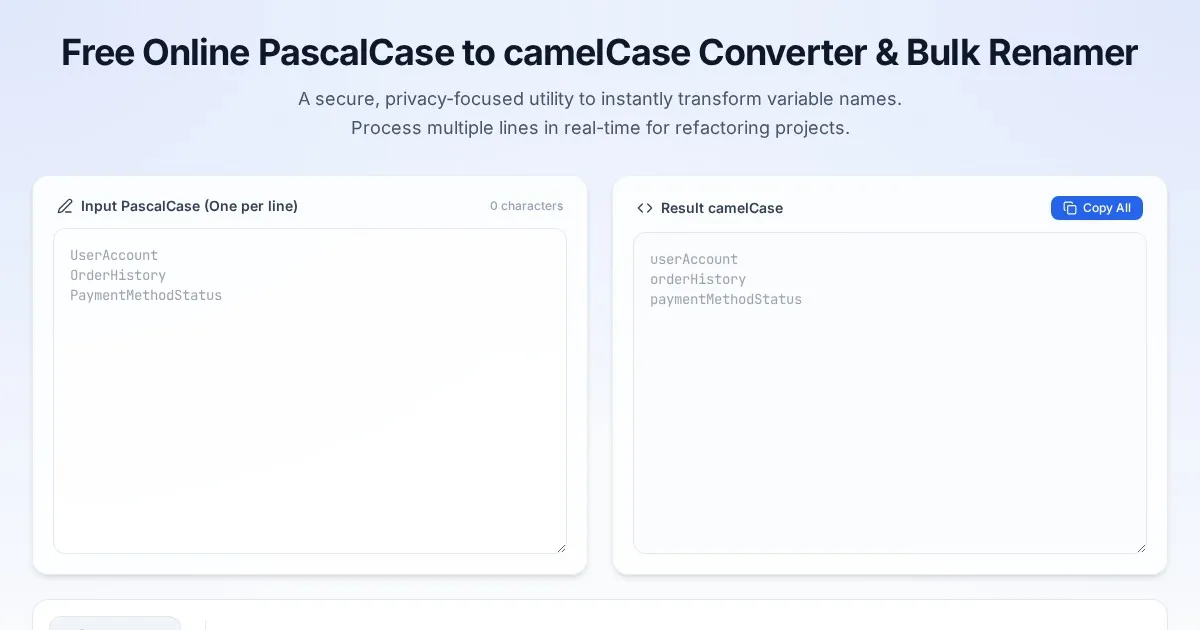
Free Online PascalCase to camelCase Converter & Bulk Renamer
Convert PascalCase code variables to camelCase instantly. A free, easy-to-use bulk variable renaming tool for developers. No server-side processing required.

Free Online Guitar Tablature Maker & Audio Player
Create, edit, and play your own guitar tablature arrangements with this free, interactive, browser-based guitar tab maker. No installation required.

Free CSS font-palette OpenType CPAL Color Font Configurator
Easily customize OpenType CPAL color fonts with this free web-based CSS font-palette generator. Configure, preview, and export CSS code for modern typography.
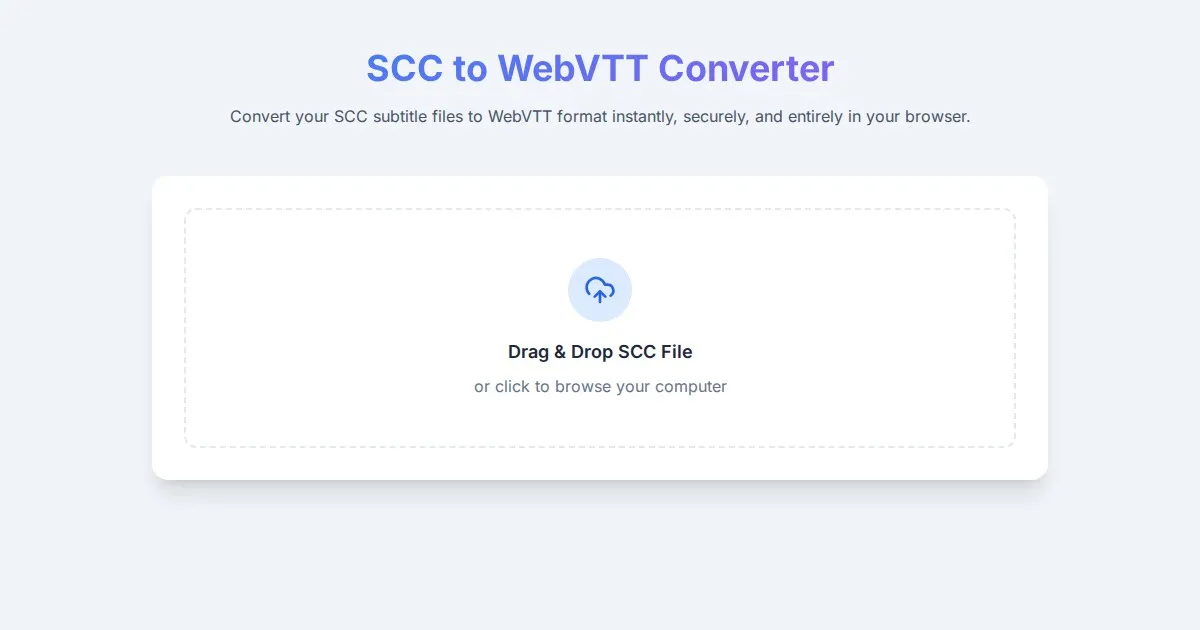
Free SCC to WebVTT Subtitle Converter Tool
Convert SCC subtitle files to WebVTT format online for free. Fast, secure, browser-based SCC to VTT conversion tool for video captioning and accessibility.
Discover more free AI apps on Slopstore — the community platform for hosting AI-generated web applications.