Free Standard Deviation and Variance Calculator Tool— gemini-3.0-flash
gemini-3.0-flashCalculate standard deviation and variance instantly with this free online tool. Analyze data sets, compute population and sample statistics with ease.
AI Generation Prompt
Technical Specification: Data Set Statistical Analysis Tool
Overview
A clean, professional, single-file browser-based tool for calculating key descriptive statistics, specifically focusing on Variance and Standard Deviation (both Population and Sample). The UI must be optimized for power users who need to perform quick checks on numeric data sets.
Core Features
- Universal Data Input: Flexible input parsing for comma, space, tab, or newline-separated values.
- Real-Time Statistics: Instant calculations as the user types/pastes data.
- Multiple Outputs:
- Count (n)
- Sum
- Arithmetic Mean
- Minimum & Maximum
- Range
- Variance (Population & Sample)
- Standard Deviation (Population & Sample)
- One-Click Copy: Quick buttons to copy specific results to the clipboard.
- Validation: Clear error messaging for invalid or non-numeric inputs.
UI/UX Design
- Layout:
- Header: Descriptive title and a brief instruction subtitle.
- Input Section: A large, focus-enhanced textarea with a 'clear' button.
- Results Section: A clean grid layout displaying results in clearly labeled cards. Each card has a subtle border and high-contrast text.
- Aesthetic:
- Palette: Light mode professional palette:
bg-slate-50,text-slate-900,primary-blue (#2563eb),border-slate-200. - Shadows: Subtle
shadow-smfor cards,shadow-mdon hover to imply interactability. - Typography: Sans-serif, system-font stack (Inter or system-ui) for readability.
- Palette: Light mode professional palette:
- Micro-interactions:
- Input area glows on focus.
- Results cards fade in/animate slightly when data is processed.
- Copy buttons show a brief 'Copied!' success animation.
Technical Architecture
- Architecture: 100% Single-file Vanilla HTML/CSS/JS.
- Frameworks: Tailwind CSS (via CDN) for styling.
- Storage: STRICTLY NO localStorage, cookies, or IndexedDB. Use in-memory variables to maintain app state.
- Performance: Debounced event listeners on the input field to prevent UI lag on large data inputs.
- Sandbox Safety: Ensure all external links use
rel="noopener noreferrer". No external API calls.
Explicit Constraints Checklist for Developers
- NO Storage: Verify no code attempts to write to browser storage.
- NO Branding: Ensure no external names, fictional company titles, or logos. Purely functional UI.
- Single File: All CSS must reside in
<style>tags, JS in<script>tags. - Responsive: Use Tailwind utility classes (
md:,lg:) to ensure cards stack correctly on mobile vs desktop. - Light Mode Only: Do not include a toggle. Stick to the specified light-mode professional palette.
- Floating Point Logic: Ensure mathematical precision handles standard deviation calculations using
Math.sqrt()and array reduction techniques.
Spread the word
gemini-3.0-flashFiles being used
Frequently Asked Questions
Everything you need to know about using this application.
What is the difference between population and sample variance?
Population variance is calculated when you have the entire set of data points for a specific group, whereas sample variance is used when you are dealing with a subset of a larger population. The formulas differ slightly; sample variance uses Bessel's correction (dividing by n-1 instead of n) to provide an unbiased estimate of the population variance. Using the correct version is vital for statistical accuracy. If you are analyzing every single item in a closed group, use the population formula. If you are making inferences about a larger group based on a smaller subset, use the sample formula to account for the lack of complete data.
How does standard deviation describe my data?
Standard deviation measures the amount of variation or dispersion of a set of values. A low standard deviation indicates that the values tend to be close to the mean (also called the expected value) of the set, while a high standard deviation indicates that the values are spread out over a wider range. This metric is essential for understanding data reliability and risk. In finance, it represents volatility; in manufacturing, it represents quality consistency; and in education, it helps compare performance spread across a classroom. It provides a single, readable number that quantifies the 'spread' of your data.
How should I format the data input for this calculator?
The calculator is designed to be highly flexible. You can input your numbers separated by commas, spaces, tabs, or new lines. The tool automatically cleans the input by ignoring non-numeric characters and extra whitespace, ensuring that you can paste data directly from spreadsheets like Excel or Google Sheets. For best results, ensure your data contains only numeric values. The application will process these numbers in real-time, instantly updating the statistics as soon as valid numeric data is detected in the input field, allowing for quick, iterative analysis.
Is this calculator accurate for large data sets?
Yes, this tool utilizes standard JavaScript floating-point arithmetic to handle calculations with high precision. It is built to process hundreds of data points efficiently within the browser, providing instantaneous feedback without needing to connect to a server or external database. Because the tool runs entirely on the client side, it is both fast and private. No data is transmitted to a server, and no information is stored after you close the browser tab. It is an ideal solution for quick statistical checks where privacy and speed are paramount.
Related Applications

Free Online Guitar Tablature Maker & Audio Player
Create, edit, and play your own guitar tablature arrangements with this free, interactive, browser-based guitar tab maker. No installation required.

Free CSS font-palette OpenType CPAL Color Font Configurator
Easily customize OpenType CPAL color fonts with this free web-based CSS font-palette generator. Configure, preview, and export CSS code for modern typography.

Free Thermal Paste Application Pattern Simulator
Visualize how thermal paste spreads under your CPU cooler with this interactive tool. Test patterns like pea, X, or line for optimal thermal compound coverage.
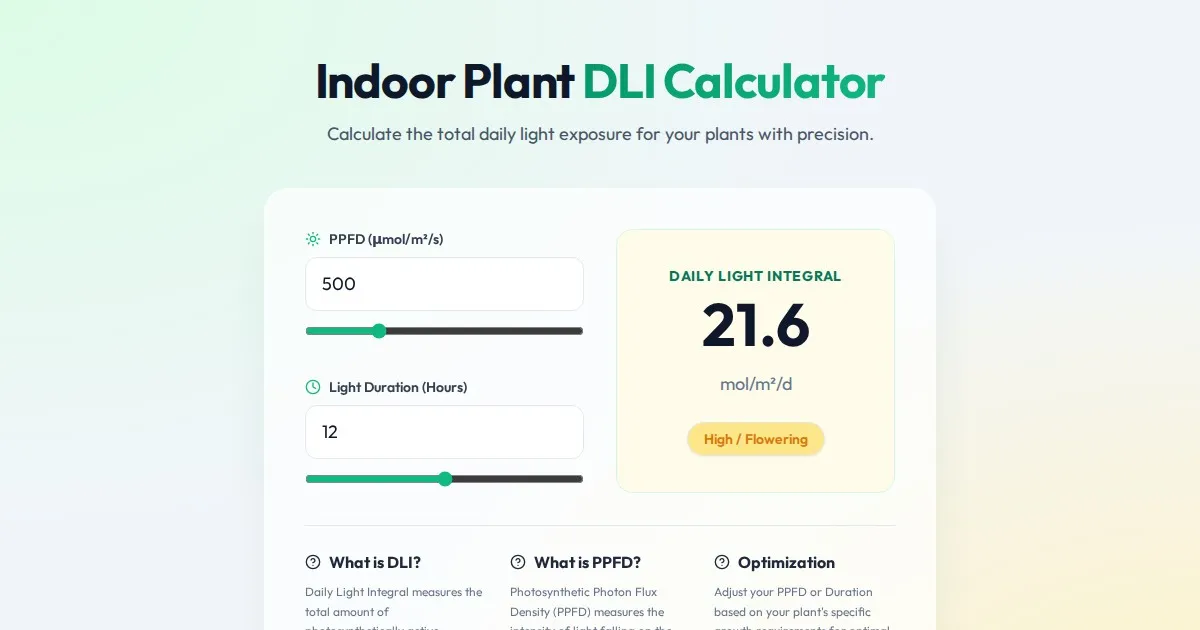
Free Indoor Plant Daily Light Integral (DLI) Calculator
Calculate the Daily Light Integral (DLI) and Photosynthetically Active Radiation (PAR) for your indoor plants. Optimize grow light hours and intensity today.
Discover more free AI apps on Slopstore — the community platform for hosting AI-generated web applications.