Free Titration Curve Generator & Equivalence Point Calculator— gemini-3.0-flash
gemini-3.0-flashVisualize chemical titration curves instantly. Calculate equivalence points for acid-base reactions using this free, browser-based, no-install chemistry graphing tool.
AI Generation Prompt
Technical Specification: Chemistry Titration Curve Generator
Overview
The Chemistry Titration Curve Generator is a client-side, browser-based tool designed to help chemistry students and researchers visualize titration curves. It calculates pH based on user-defined parameters and plots the resulting data in a professional, responsive chart.
Core Features
- Dynamic Simulation: Real-time calculation of pH based on analyte and titrant molarity, volume, and pKa/pKb values.
- Multi-protic Support: Ability to define multiple pKa values for complex acid/base reactions.
- Automated Analysis: Detection of equivalence points using numerical differentiation (first derivative).
- High-Resolution Export: Download the chart as a high-quality PNG image.
- Responsive UI: Fully functional on desktop and mobile browsers.
UI/UX Design
- Layout:
- Header: Clean, minimalist title with a short description.
- Main Area: Split screen design. Left sidebar (30% width) for input parameters; Right main view (70% width) for the interactive chart.
- Responsive behavior: On small screens, the sidebar stacks above the chart.
- Color Palette:
- Background: Off-white (#FAFAFA) for a clean, non-glaring look.
- Primary: Deep Indigo (#4F46E5) for interactive elements and primary chart lines.
- Secondary: Slate Grey (#64748B) for labels and supporting text.
- Alert/Info: Emerald (#10B981) for equivalence point markers.
- Animations:
- Smooth chart re-renders when inputs change (using CSS transitions for container resizing).
- Subtle hover effects on input fields and buttons (scaling/box-shadow).
Technical Implementation Constraints
- Single File: All HTML, CSS, and JavaScript must be contained in one file. External assets (like Chart.js) must be linked via secure CDNs.
- Zero Persistence: NO usage of
localStorage,sessionStorage, or cookies. The state is transient and resets on refresh. - Performance: Calculations must be performed in the main thread without blocking, ensuring smooth UI interactions.
- Sandboxing: Code must be compatible with a null-origin iframe environment (no calls to
alert(),prompt(), etc.). - Dependency Strategy: Use standard libraries (e.g., Chart.js) for graphing. Vanilla JS for all logic (calculating equilibrium constants, plotting logic).
Implementation Roadmap
- Setup: Basic HTML5 boilerplate with CDN links for Chart.js and Tailwind CSS (via CDN).
- State Management: A single
stateobject holding current input values (molarity, volumes, etc.). - Calculation Engine: JS function to iterate through volume increments and compute pH based on the Henderson-Hasselbalch equation and chemical equilibrium constants.
- Graph Rendering: Chart.js configuration to draw the curve using the dataset generated by the calculation engine.
- Equivalence Finder: Algorithm to iterate through the dataset, find the maximum slope (derivative), and plot a coordinate/marker on the chart.
- Export: Logic to generate a Blob from the chart canvas to enable file downloads.
Spread the word
gemini-3.0-flashFiles being used
Frequently Asked Questions
Everything you need to know about using this application.
How does the titration curve generator calculate the equivalence point?
The tool utilizes standard chemical equilibrium equations for monoprotic and polyprotic acids to calculate pH values at incremental volumes of titrant added. By generating a large dataset of pH versus volume, it creates a precise titration curve that mirrors real-world laboratory conditions accurately. To find the equivalence point, the application automatically performs a numerical differentiation on the generated dataset. It identifies the inflection point of the titration curve—the precise location where the rate of change of pH is highest—and marks it clearly on the chart for the user to analyze.
Is this tool suitable for complex polyprotic acid titrations?
Yes, the simulation engine is designed to handle multiple dissociation constants (pKa values). By inputting the specific pKa values of the analyte, the graph will correctly render multiple equivalence points corresponding to each step of the dissociation process for polyprotic acids like phosphoric or sulfuric acid. Users can adjust the volume and concentration parameters to simulate various experimental setups, making it a robust tool for students and laboratory professionals. The calculation logic accounts for the buffering regions and the sharp vertical jumps associated with neutralization points.
Can I export the titration curve for my lab reports?
Absolutely. The application features a built-in 'Export' function that allows you to download your generated titration graph directly as an image file. This ensures you can easily include your visualized data in digital lab reports, presentations, or academic assignments without needing external graphing software. In addition to image export, the tool provides a tabular summary of the data points, which can be copied and pasted into spreadsheet applications like Excel or Google Sheets. This flexibility ensures that you have full access to both the visual chart and the underlying numerical data for further analysis.
Do I need to install any software to run this titration plotter?
No installation is required. This tool is a single-file, client-side web application that runs entirely within your modern web browser. Simply open the file in any standard browser to begin your calculations without the need for plugins, accounts, or persistent storage. Because it relies on client-side processing, your data is never sent to a server, ensuring privacy and security. You can use it on any device with a screen, from laptops to tablets, making it highly portable for both classroom work and independent laboratory experimentation.
Related Applications
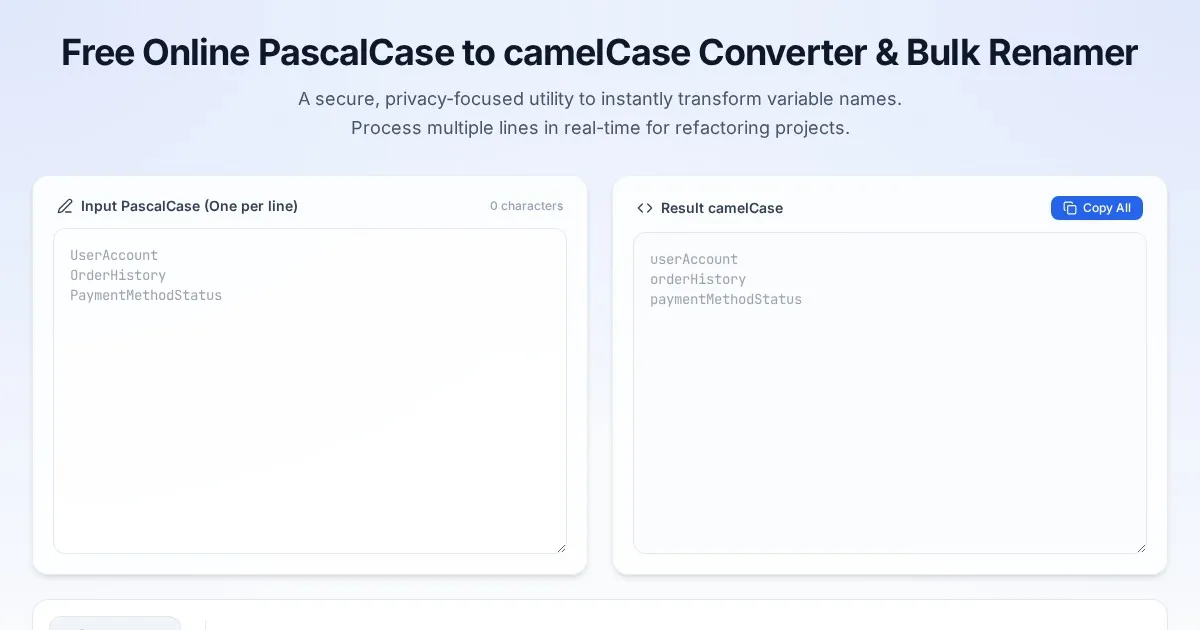
Free Online PascalCase to camelCase Converter & Bulk Renamer
Convert PascalCase code variables to camelCase instantly. A free, easy-to-use bulk variable renaming tool for developers. No server-side processing required.

Free Online Guitar Tablature Maker & Audio Player
Create, edit, and play your own guitar tablature arrangements with this free, interactive, browser-based guitar tab maker. No installation required.

Free CSS font-palette OpenType CPAL Color Font Configurator
Easily customize OpenType CPAL color fonts with this free web-based CSS font-palette generator. Configure, preview, and export CSS code for modern typography.
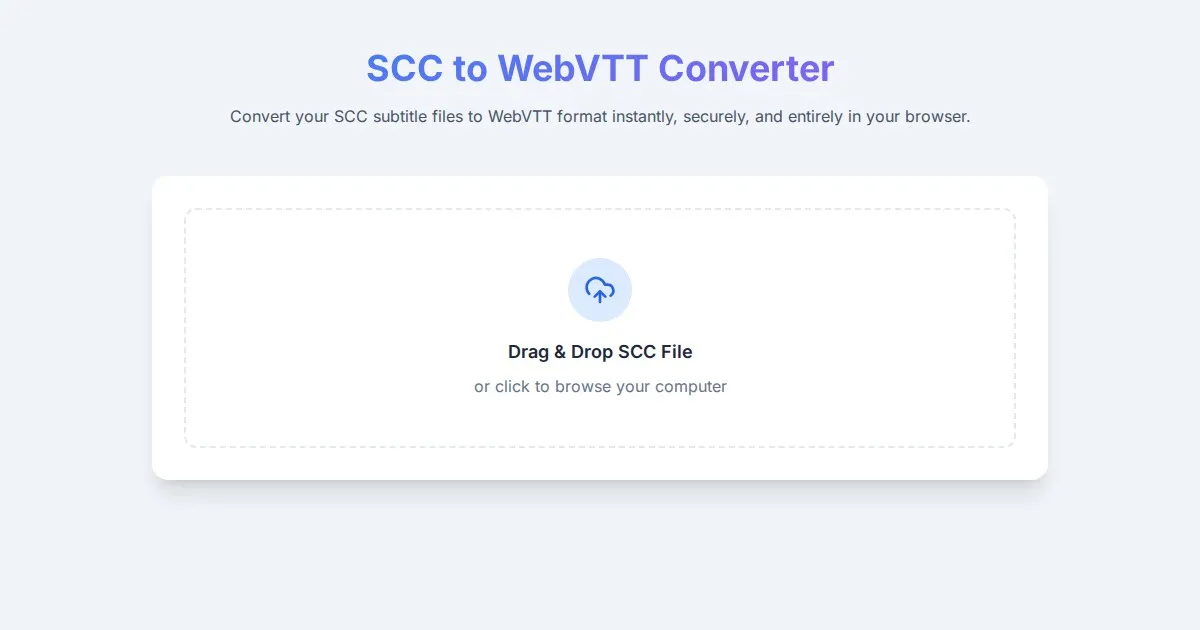
Free SCC to WebVTT Subtitle Converter Tool
Convert SCC subtitle files to WebVTT format online for free. Fast, secure, browser-based SCC to VTT conversion tool for video captioning and accessibility.
Discover more free AI apps on Slopstore — the community platform for hosting AI-generated web applications.