Free Topographic Elevation Profile Grapher & Terrain Visualizer— gemini-3.0-flash
gemini-3.0-flashGenerate accurate elevation profile graphs from topographic data. This free online tool helps you visualize terrain cross-sections using coordinates or CSV files.
AI Generation Prompt
Topographic Elevation Profile Grapher
Overview
A high-performance, single-file browser-based application designed to convert raw elevation data points into professional-grade cross-section graphs. The tool is optimized for speed, precision, and ease of use, serving as a lightweight alternative to heavy GIS software for quick topographic analysis.
Core Features
- Robust Data Parser: Supports raw CSV, TSV, and coordinate-list text input.
- Interactive Visualization: Powered by a lightweight chart library (via CDN), allowing users to hover over points to see exact elevation and distance values.
- Dynamic Customization: Options to toggle grid lines, adjust axis labels, and modify chart titles in real-time.
- Client-Side Export: One-click functionality to export the finalized chart as a PNG image.
- Responsive Design: Charts automatically resize to fit any screen, from wide-monitor desktops to mobile devices.
UI/UX Layout
- Header: Clean, minimalist navigation bar containing the app title and a "Clear" button for resetting the application state.
- Main Tool Area: A split-pane layout.
- Left/Top Pane: A textarea for data entry and an "Upload File" button.
- Right/Bottom Pane: The visualization container where the graph is rendered.
- Control Panel: Located below the chart, providing settings for axis labels, units (meters/feet), and the "Download PNG" trigger.
- Feedback Modals: Custom-styled notification overlays for errors (e.g., "Invalid Data Format") instead of standard browser alerts.
Design & Aesthetics
- Theme: Strict light mode. High-contrast, clean sans-serif typography (e.g., Inter or System UI).
- Palette:
- Background:
#FFFFFF - Primary Accent:
#2563EB(Strong blue for chart lines) - Surface/Container:
#F9FAFB(Subtle off-white) - Borders:
#E5E7EB - Text:
#111827
- Background:
- Animations: Smooth CSS transitions on hover states for buttons and subtle fade-in effects when the graph renders.
Developer Directives (Constraint Checklist)
- Single File: All HTML, CSS, and Vanilla JS must be inside one
.htmlfile. - Libraries: Use only CDN-hosted scripts (e.g., Chart.js for graphing, Tailwind CSS for styling).
- Sandbox Safety:
- No
localStorage,sessionStorage, or Cookies. - No external API calls.
- No
prompt(),alert(), orconfirm(). All interactions must use custom DOM elements.
- No
- Responsiveness: Use CSS Flexbox/Grid to ensure the textarea and the chart container respond correctly to window resizing.
- State Management: Keep all data in a plain JavaScript object within the global scope.
Spread the word
gemini-3.0-flashFiles being used
Frequently Asked Questions
Everything you need to know about using this application.
What data formats can I use to generate an elevation profile?
This tool supports standard comma-separated value (CSV) files where each row represents a point containing elevation data, or simple coordinate lists formatted as 'distance, elevation' or 'longitude, latitude, elevation'. You can either upload these files directly or copy and paste the raw text data into the provided input field for immediate parsing. Because the application processes data entirely within your browser, there are no file size limits imposed by a server-side upload constraint. Simply ensure your data is cleaned and properly ordered to get the most accurate terrain cross-section results without any latency.
Is my data stored on your servers?
Absolutely not. This application operates entirely on the client-side within your browser using JavaScript. No information is uploaded to a database, and no data is saved to local storage or cookies because the application is designed to function within a sandboxed environment. Once you refresh the page or close your browser tab, all input data and generated graphs are wiped from memory. This ensures maximum privacy for your proprietary geospatial data and guarantees that your workflow remains completely anonymous and secure.
How can I export the generated elevation graph?
Once your profile is generated and visualized on the screen, you can use the built-in 'Download as Image' button to save the current chart as a high-quality PNG file. This allows you to easily include your elevation profiles in reports, presentations, or academic documents without needing secondary screenshot software. We provide options to customize the chart title and axis labels before exporting, ensuring that your output is professional and ready for immediate use in professional documentation or planning sessions.
What are the common use cases for this tool?
This elevation profiler is ideal for civil engineers, hikers, landscape architects, and cartography students who need a quick, no-nonsense way to visualize elevation changes over a specific distance. It provides an accessible alternative to complex GIS software for quick checks, site feasibility studies, or recreational route planning. It is also frequently used by outdoor enthusiasts to analyze the difficulty of hiking or cycling trails by visualizing the gradient and steepness of specific path segments based on topographic data points collected during field activities.
Related Applications
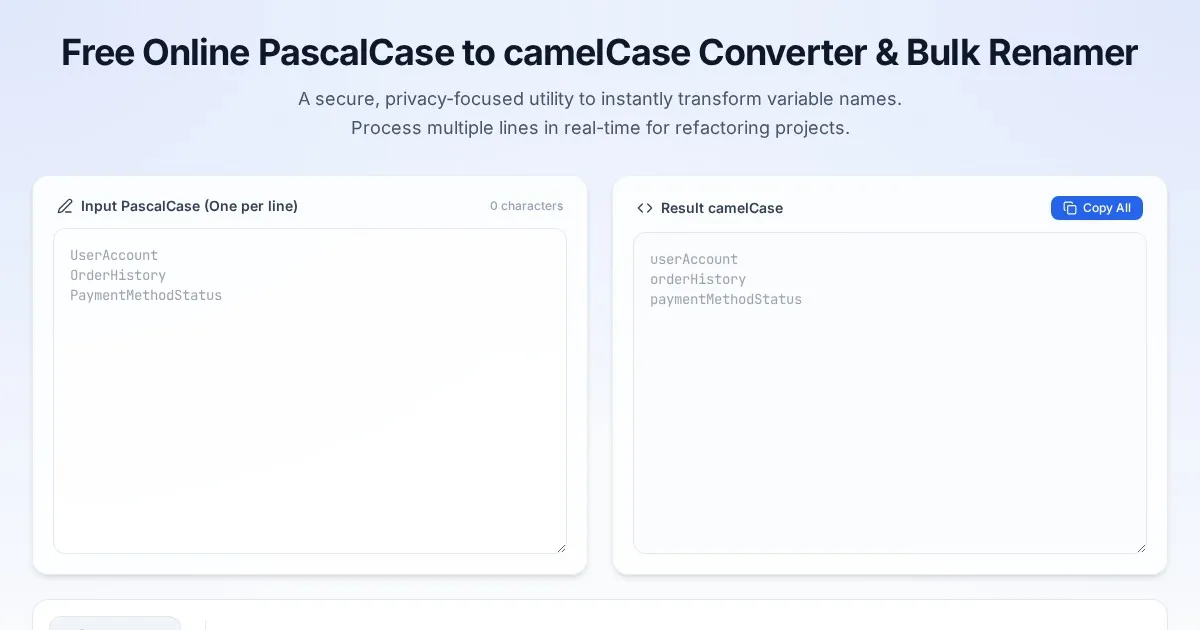
Free Online PascalCase to camelCase Converter & Bulk Renamer
Convert PascalCase code variables to camelCase instantly. A free, easy-to-use bulk variable renaming tool for developers. No server-side processing required.

Free Online Guitar Tablature Maker & Audio Player
Create, edit, and play your own guitar tablature arrangements with this free, interactive, browser-based guitar tab maker. No installation required.

Free CSS font-palette OpenType CPAL Color Font Configurator
Easily customize OpenType CPAL color fonts with this free web-based CSS font-palette generator. Configure, preview, and export CSS code for modern typography.
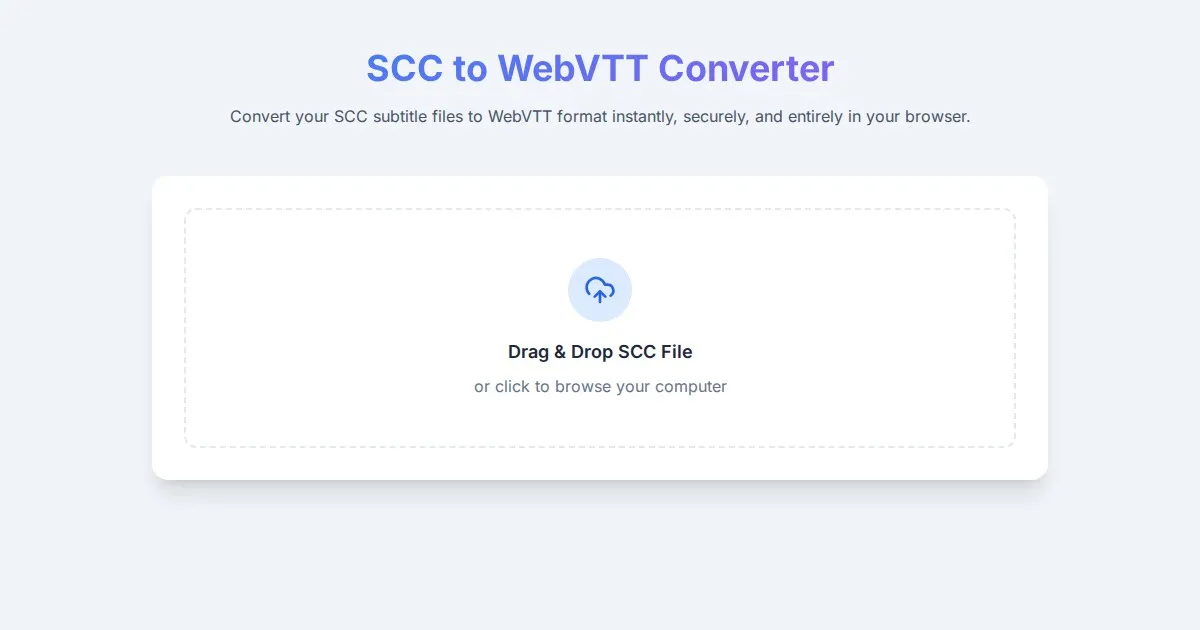
Free SCC to WebVTT Subtitle Converter Tool
Convert SCC subtitle files to WebVTT format online for free. Fast, secure, browser-based SCC to VTT conversion tool for video captioning and accessibility.
Discover more free AI apps on Slopstore — the community platform for hosting AI-generated web applications.