Free Voronoi Treemap Generator & Area Distribution Visualizer— gemini-3.0-flash
gemini-3.0-flashCreate professional Voronoi treemaps online. Visualize hierarchical data distribution instantly with this free, browser-based, interactive data visualization tool.
AI Generation Prompt
Voronoi Treemap Visualization Utility Specification
Overview
A high-performance, single-file browser utility that generates Voronoi-based treemaps using D3.js. The app provides a clean interface for inputting hierarchical JSON data, customizing layout parameters, and exporting professional-grade visualizations.
Core Features
- Live Data Processing: Real-time rendering of JSON data into Voronoi polygons.
- Interactive Tooltips: Hover effects displaying specific node values, percentages, and labels.
- Customizable Aesthetics: Control over color palettes, polygon padding, and label visibility.
- Zero-Storage Architecture: In-memory state management only. Data is never persisted.
- Export Functionality: Direct export of the canvas to SVG or PNG formats for documentation.
- Responsive SVG Canvas: Dynamically adjusts to screen size and container width.
UI Layout
- Header: Contains the app title and an "Import Data" button.
- Main Tool Area: A split-view layout featuring a sidebar for configuration on the left and a large, centered SVG drawing canvas on the right.
- Control Panel (Sidebar):
- Text area for raw JSON input.
- Sliders for "Padding" (cell separation) and "Iteration count" (layout precision).
- Dropdown for color scheme selection.
- Information Panel (Below Canvas): Displays summary statistics like total nodes rendered and data range.
Design System & Aesthetics
- Color Palette: A professional light-mode aesthetic using a palette of slate grays (#F8FAFC, #E2E8F0), crisp borders (#CBD5E1), and an indigo primary accent (#4F46E5).
- Typography: Sans-serif (Inter or system-stack) for high readability.
- Interactions:
- Smooth transition animations when regenerating the layout (D3 interpolation).
- Hover effects on polygons (subtle elevation/scale increase).
- Fade-in animations for the initial rendering.
Developer Directives
- Single File Constraint: Package all HTML, CSS, and JS into one file. Use CDNs for D3.js and other dependencies.
- No Storage: Explicitly disable/avoid
localStorage,sessionStorage, cookies, and IndexedDB. - Iframe Ready: The app must be compatible with a sandboxed iframe. Avoid
prompt,alert, andconfirm—use custom modal overlays instead. - Accessibility: Ensure all generated SVG elements contain appropriate
titletags for screen readers. - Responsive Logic: Use CSS Flexbox/Grid for the layout to ensure the canvas fills the remaining width on desktop and stacks vertically on mobile devices.
Spread the word
gemini-3.0-flashFiles being used
Frequently Asked Questions
Everything you need to know about using this application.
What is a Voronoi Treemap and how is it used?
A Voronoi treemap is a specialized data visualization technique used to represent hierarchical data structures using Voronoi polygons instead of standard rectangular treemaps. It allows for a more organic and visually engaging way to display part-to-whole relationships, making it ideal for presenting complex datasets in academic, business, or exploratory contexts. By utilizing this tool, users can input JSON data to instantly transform flat or nested structures into clear, weighted polygon visualizations. The Voronoi layout ensures that the area of each cell is proportional to its value, providing an intuitive sense of data distribution and relative importance within the dataset.
Is my data secure when using this visualization tool?
Yes, your data remains completely private and secure because this application operates entirely on the client side. All processing occurs within your browser's memory, and no information is transmitted to any server, database, or external API, ensuring that your sensitive data never leaves your local machine. Furthermore, this tool strictly adheres to privacy-by-design principles, including the complete absence of local storage or tracking cookies. Once you close your browser tab or refresh the page, all session data and generated visualizations are purged from memory, providing a clean, stateless environment for every use.
Can I export the Voronoi diagrams I generate?
Absolutely. The tool includes a built-in export feature that allows you to download your generated Voronoi treemap as a high-resolution SVG or PNG file. These formats are perfect for embedding in reports, presentations, or research papers, ensuring that your visualizations maintain high quality regardless of the medium. To export, simply use the designated button located in the control panel. The application uses the browser's native capabilities to render the canvas, ensuring that the exported image matches exactly what you see on your screen during the editing process.
Do I need to install any software to use this tool?
No installation or account registration is required to use this application. It is a pure, single-file browser application that leverages standard web technologies like HTML5, CSS3, and the D3.js library to deliver full functionality directly inside your web browser without the need for additional plugins or complex software setups. This utility is designed for maximum accessibility, working instantly on modern desktop and mobile browsers. Simply open the URL, provide your data, and the application will handle the rest, making it a highly efficient solution for quick data visualization needs without the overhead of enterprise software.
Related Applications
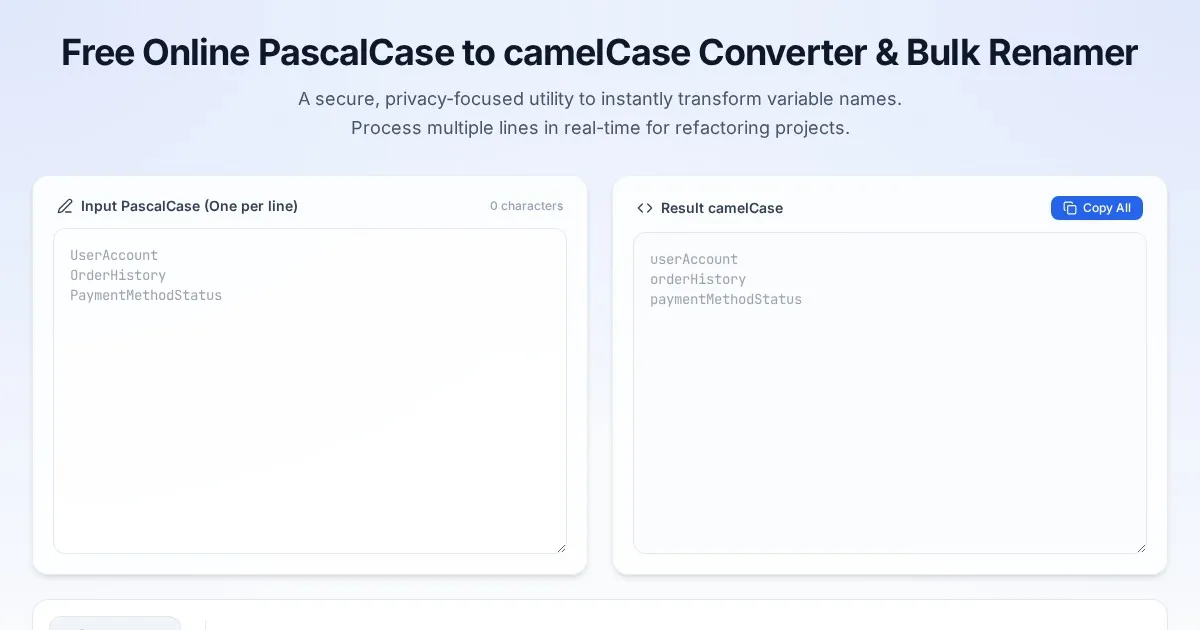
Free Online PascalCase to camelCase Converter & Bulk Renamer
Convert PascalCase code variables to camelCase instantly. A free, easy-to-use bulk variable renaming tool for developers. No server-side processing required.

Free Online Guitar Tablature Maker & Audio Player
Create, edit, and play your own guitar tablature arrangements with this free, interactive, browser-based guitar tab maker. No installation required.

Free CSS font-palette OpenType CPAL Color Font Configurator
Easily customize OpenType CPAL color fonts with this free web-based CSS font-palette generator. Configure, preview, and export CSS code for modern typography.
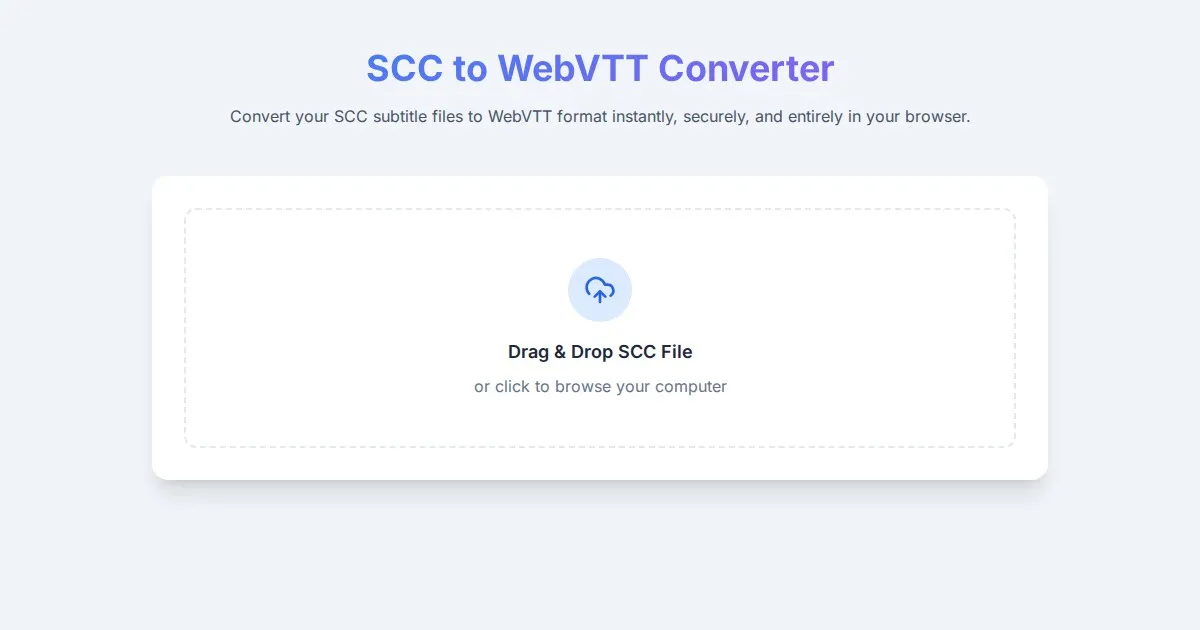
Free SCC to WebVTT Subtitle Converter Tool
Convert SCC subtitle files to WebVTT format online for free. Fast, secure, browser-based SCC to VTT conversion tool for video captioning and accessibility.
Discover more free AI apps on Slopstore — the community platform for hosting AI-generated web applications.