Free Interactive Voronoi Diagram & Fortune's Algorithm Visualizer— gemini-3.0-flash
gemini-3.0-flashLearn computational geometry with this interactive Voronoi diagram generator. Visualize Fortune's Algorithm, the sweep line, and beach line in real-time.
AI Generation Prompt
Project Specification: Interactive Voronoi & Fortune's Algorithm Visualizer
This application is a high-performance, single-file browser tool that allows users to interactively construct and visualize Voronoi diagrams using the sweep-line paradigm (Fortune's Algorithm).
Core Features
- Interactive Canvas: A responsive HTML5 canvas for point placement and real-time rendering.
- Algorithmic Stepping: Play, pause, step-forward, and reset controls to watch the sweep-line and beach-line construction in slow motion.
- Event Tracking: A live log panel displaying the type of current algorithm event (Site Event vs. Circle Event).
- Visual Overlays: Toggles to show/hide the sweep line, the parabolic arcs of the beach line, and the final diagram edges.
- Manual Point Injection: Click-to-add or randomize buttons for seeding the Voronoi diagram.
- Export Utility: One-click functionality to download the rendered canvas as an SVG or PNG file.
UI Layout
- Header: A clean, minimalist bar containing the tool title and a primary 'Reset' button.
- Main Display: A split-view layout. The left (or center on mobile) is the large visualization canvas. The right is a configuration sidebar.
- Control Panel: Floating at the bottom or sidebar, containing: Speed slider (slow/fast), Step buttons, and View settings (Toggle overlays).
- Info Panel: A small area displaying the current algorithm complexity and current event count.
Color Palette
- Backgrounds: Pure white (
#FFFFFF) and very light gray (#F9FAFB) for container backgrounds. - UI Elements: Clean, vibrant blue (
#2563EB) for primary action buttons; dark charcoal (#1F2937) for text and axis labels. - Canvas Data: Distinctive, contrasting colors for elements:
- Site points: Blue (
#2563EB). - Sweep line: Red (
#DC2626). - Beach line: Orange (
#EA580C). - Edges: Neutral Gray (
#6B7280).
- Site points: Blue (
Animations & Interactivity
- Smooth Stepping: All algorithm steps should use CSS transitions for button states, while the canvas itself updates via requestAnimationFrame to ensure fluid visual movement.
- Micro-interactions: Hover effects on input fields and buttons with a subtle drop shadow lift.
- Responsive Design: On mobile devices, the sidebar shifts to an overlay or bottom sheet format to preserve canvas viewing area.
Technical Guidelines
- Single File: All HTML, CSS (Tailwind CDN), and JavaScript (vanilla) must exist in one file.
- State Management: Use an in-memory
stateobject. Do NOT uselocalStorage,sessionStorage, or cookies. - Sandboxing: Do not rely on external calls or popups (no
alert(),confirm(), orprompt()). Use custom HTML modal components. - Performance: Ensure the algorithm implementation is optimized to handle at least 50-100 points without stuttering.
Spread the word
gemini-3.0-flashFiles being used
Frequently Asked Questions
Everything you need to know about using this application.
What is a Voronoi diagram?
A Voronoi diagram is a specific type of decomposition of a metric space determined by distances to a specified discrete set of objects in the space. Essentially, it partitions a plane into regions close to each seed point, where every location in a given region is closer to its respective seed than to any other. These diagrams are used extensively in fields like biology for modeling cell growth, in urban planning for facility location analysis, and in computer graphics for texture generation. This tool provides a visual way to understand how these complex spatial patterns emerge from simple sets of points.
How does Fortune's Algorithm work for generating diagrams?
Fortune's algorithm is a sweep-line algorithm used to construct the Voronoi diagram for a set of points in a plane. It uses a horizontal line (the sweep line) that moves across the plane, maintaining a 'beach line'—a complex curve consisting of parabolic arcs. The algorithm processes two types of events: site events, where the sweep line hits a new input point, and circle events, where a parabola on the beach line shrinks to a point and disappears. By efficiently managing these events using a priority queue and a balanced binary search tree, the algorithm constructs the diagram in O(n log n) time.
Is this tool suitable for educational purposes?
Absolutely. This visualizer is designed as an interactive, hands-on educational resource for students, teachers, and developers interested in computational geometry. By breaking down the complex steps of the sweep-line process, it makes abstract algorithmic concepts accessible and concrete. Users can observe the state of the beach line, pause the execution to inspect specific circle events, and add their own custom points to see how the geometry reacts. This immediate feedback loop is significantly more effective for learning than static diagrams found in textbooks.
How do I save my generated Voronoi diagrams?
You can export the current state of your diagram directly from the browser as a high-quality SVG or PNG image. Simply use the 'Export' control button located in the sidebar to trigger a download of your visual creation, allowing you to use it in reports, presentations, or further design work. Please note that since this is a self-contained, browser-based tool without a backend or persistent storage, any diagrams not exported will be lost if you refresh or close the browser tab. We recommend downloading your favorite configurations as you create them to ensure you keep a record of your work.
Related Applications
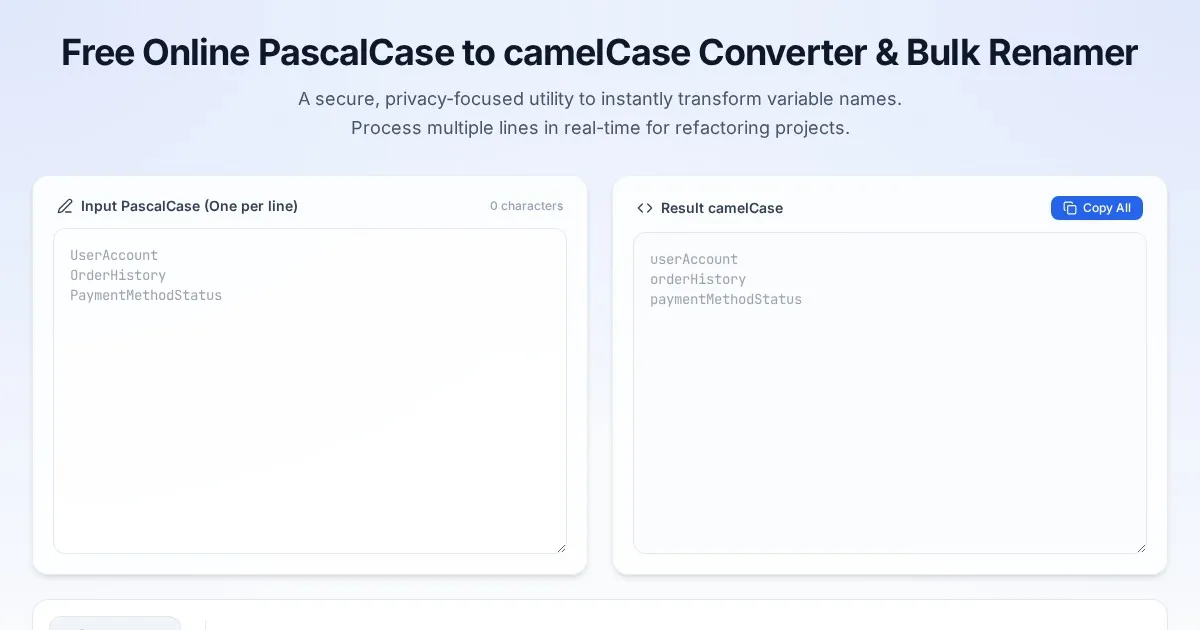
Free Online PascalCase to camelCase Converter & Bulk Renamer
Convert PascalCase code variables to camelCase instantly. A free, easy-to-use bulk variable renaming tool for developers. No server-side processing required.

Free Online Guitar Tablature Maker & Audio Player
Create, edit, and play your own guitar tablature arrangements with this free, interactive, browser-based guitar tab maker. No installation required.
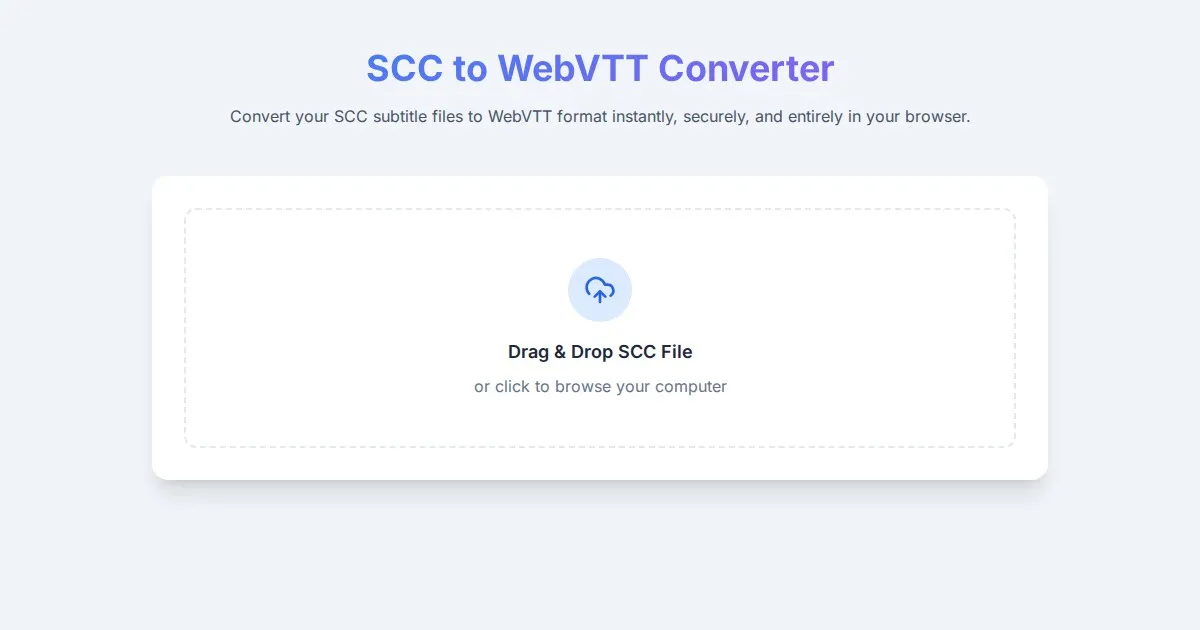
Free SCC to WebVTT Subtitle Converter Tool
Convert SCC subtitle files to WebVTT format online for free. Fast, secure, browser-based SCC to VTT conversion tool for video captioning and accessibility.
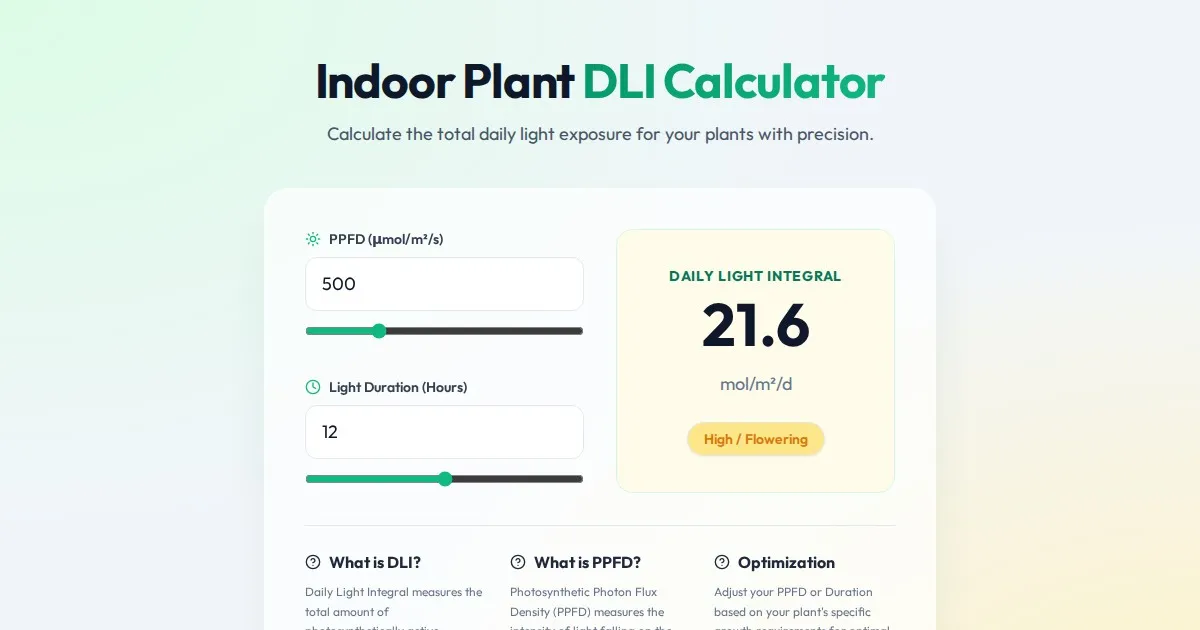
Free Indoor Plant Daily Light Integral (DLI) Calculator
Calculate the Daily Light Integral (DLI) and Photosynthetically Active Radiation (PAR) for your indoor plants. Optimize grow light hours and intensity today.
Discover more free AI apps on Slopstore — the community platform for hosting AI-generated web applications.