Free Physics Projectile Motion Simulator with Air Resistance— gemini-3.0-flash
gemini-3.0-flashCalculate projectile trajectory with air resistance using our free simulator. Model real-world motion, drag coefficients, and flight paths for educational use.
AI Generation Prompt
Physics Projectile Drag and Air Resistance Simulator
Overview
A comprehensive, browser-based physics tool designed to simulate projectile motion under the influence of air resistance (drag). Unlike standard parabola-based simulators, this tool performs real-time numerical integration to show how drag, gravity, and object properties interact to create real-world trajectories.
Key Features
- Real-time Numerical Simulation: Uses high-precision integration to calculate trajectories frame-by-frame.
- Customizable Environment: Adjust gravity, air density, and launch angle.
- Object Presets: Quickly load physics profiles for common objects (e.g., Basketball, Tennis Ball, Bullet, Feather).
- Comparison Mode: Toggle between ideal vacuum flight (parabolic) and real-world flight (drag-influenced) to see the performance difference.
- Detailed Metrics: Live results table showing peak height, total horizontal distance, total flight time, and final impact velocity.
- Interactive Canvas: A responsive graph that scales automatically as the projectile travels.
UI/UX Design
- Aesthetic: A clean, vibrant, professional light-mode interface. Use a color palette of soft blues, crisp whites, and distinct professional accent colors (e.g., slate-700 for text, indigo-600 for primary actions, emerald-500 for success/results).
- Layout:
- Sidebar/Control Panel: Located on the left (or top on mobile). Contains sliders and number inputs for all physics variables.
- Main Visualization: A large, centered interactive area using HTML5 Canvas to render the flight path.
- Metrics Panel: Located below the visualization, displaying a summary table of the calculated flight data.
- Animations: Smooth, easing-in/out transitions for input value changes and UI panel toggles. The trajectory drawing should have a 'draw-in' animation upon calculation completion.
Technical Specifications
- Architecture: Single-file HTML5/CSS3/Vanilla JS application.
- Libraries:
Math.jsfor robust mathematical calculations.Tailwind CSS(via CDN) for responsive design and layout styling.
- Iframe Compatibility:
- Storage: No usage of
localStorage,sessionStorage, or cookies. State is maintained in memory objects. - Security: No external script injections beyond defined CDN libraries. All UI interactions (alerts/inputs) are custom HTML modals, not browser native popups.
- Responsive: Fluid layout using Flexbox/Grid. On mobile, the control panel shifts to a collapsible drawer format to maximize canvas space.
- Storage: No usage of
- Performance: Efficient integration loops to ensure 60FPS simulation speeds even on lower-end devices.
Developer Instructions
- State Management: Create a central
const state = { ... }object to hold current input values. Any change to these values should trigger a recalculation function which updates the visual canvas. - No Storage: Do not persist settings. Reset to default values on page reload.
- Clean Code: Use strictly clean, modern ES6+ JavaScript. No legacy global variables.
- Accessibility: Ensure all sliders and inputs have associated
<label>elements for screen readers. Maintain high contrast ratios for text on light backgrounds.
Spread the word
gemini-3.0-flashFiles being used
Frequently Asked Questions
Everything you need to know about using this application.
How does air resistance affect projectile motion compared to a vacuum?
In a vacuum, a projectile follows a perfect parabolic trajectory determined solely by initial velocity and gravity. When you introduce air resistance, the projectile encounters a drag force that acts opposite to its direction of motion, which is dependent on its velocity, cross-sectional area, and shape. This drag force effectively 'eats' kinetic energy, causing the object to slow down throughout its flight. Consequently, the actual trajectory becomes steeper on the descent, the peak height is lower, and the horizontal range is significantly shorter than in vacuum conditions.
Can I use this tool for academic or classroom physics projects?
Absolutely. This tool is specifically designed as an educational aid to help students visualize the impact of external forces on classical mechanics. By allowing users to manipulate variables like the drag coefficient and air density, it serves as a powerful sandbox for testing various hypotheses. Teachers and students can use it to perform 'what-if' analyses, such as how changing the mass or surface area of a projectile impacts its terminal velocity or total flight duration. It provides a clean, visual way to bridge the gap between theoretical textbook physics and real-world results.
What mathematics and libraries power this simulation?
The application performs numerical integration on every animation frame to solve the differential equations of motion under drag. It leverages the precision of the Math.js library to handle the complex arithmetic required for high-accuracy trajectory estimation in real-time. For visual rendering, the tool utilizes the HTML5 Canvas API alongside optimized charting logic. This combination ensures that the calculations remain responsive and accurate even when you adjust parameters like wind speed or air density on the fly.
How do I interpret the data displayed in the results table?
The results table provides critical flight metrics, including the total horizontal range, peak altitude, total flight time, and final impact velocity. These values update automatically whenever you change an input parameter, allowing for immediate comparative analysis. We recommend using the 'Compare' feature, which lets you toggle between a vacuum trajectory (dashed line) and your current air-resistance configuration (solid line). This side-by-side visualization is the best way to understand the percentage loss in performance caused by atmospheric drag.
Related Applications
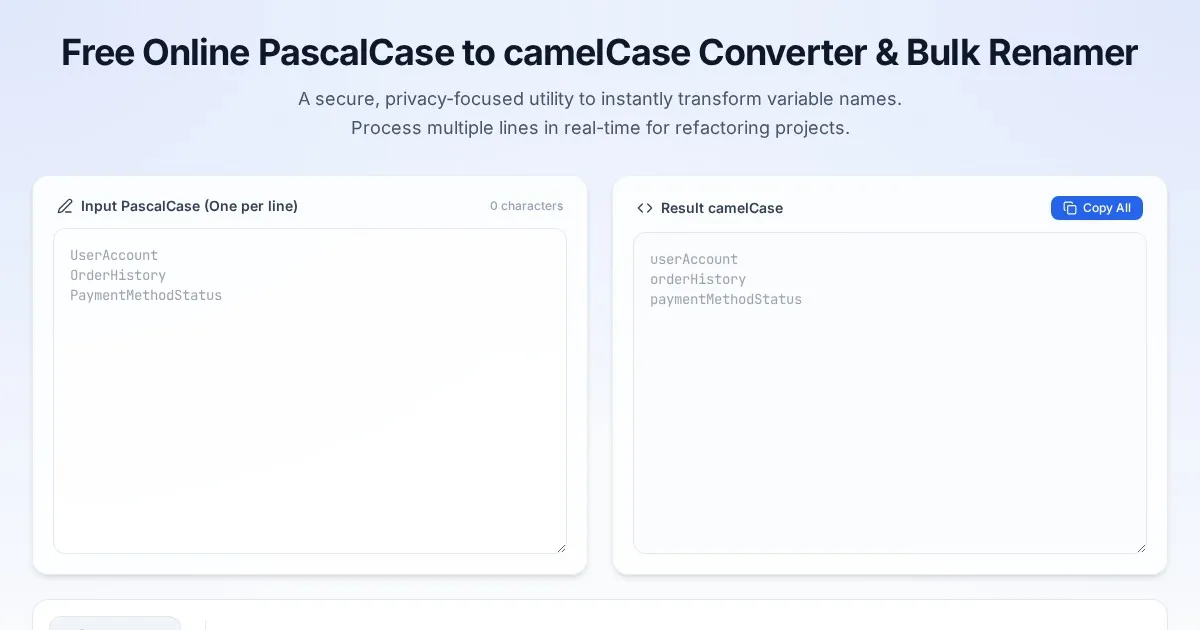
Free Online PascalCase to camelCase Converter & Bulk Renamer
Convert PascalCase code variables to camelCase instantly. A free, easy-to-use bulk variable renaming tool for developers. No server-side processing required.

Free Online Guitar Tablature Maker & Audio Player
Create, edit, and play your own guitar tablature arrangements with this free, interactive, browser-based guitar tab maker. No installation required.

Free CSS font-palette OpenType CPAL Color Font Configurator
Easily customize OpenType CPAL color fonts with this free web-based CSS font-palette generator. Configure, preview, and export CSS code for modern typography.
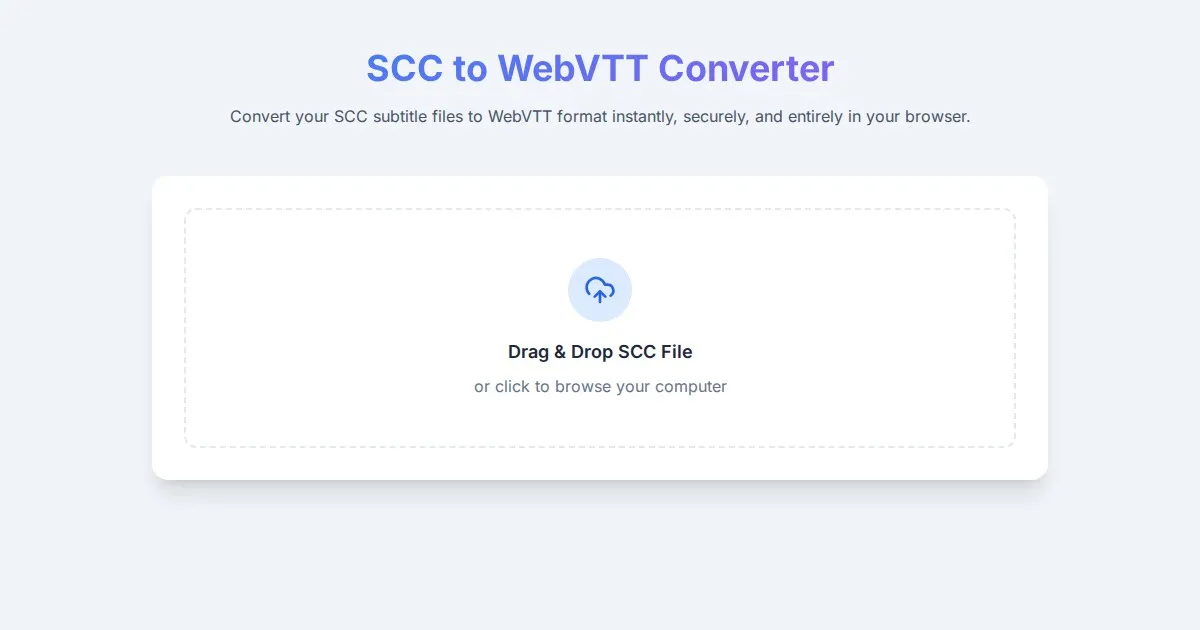
Free SCC to WebVTT Subtitle Converter Tool
Convert SCC subtitle files to WebVTT format online for free. Fast, secure, browser-based SCC to VTT conversion tool for video captioning and accessibility.
Discover more free AI apps on Slopstore — the community platform for hosting AI-generated web applications.