Free Polar to Cartesian Coordinate Converter and Grapher— gemini-3.0-flash
gemini-3.0-flashConvert polar coordinates to Cartesian (x, y) instantly with this free online tool. Visualize polar equations and points on an interactive coordinate graph.
AI Generation Prompt
Free Polar to Cartesian Coordinate Converter and Grapher
Overview
A high-performance, browser-based mathematical utility designed for students, engineers, and educators. This tool enables seamless conversion between Polar (r, θ) and Cartesian (x, y) coordinate systems while providing a real-time, interactive graphing canvas to visualize points and polar equations.
Feature List
- Dual Conversion Mode: Instant conversion from (r, θ) to (x, y) and vice versa.
- Interactive Graphing Canvas: A responsive HTML5 Canvas that maps converted coordinates in real-time.
- Polar Equation Plotter: Support for common polar functions (e.g., r = a + b cos(θ)) with adjustable parameters.
- Unit Flexibility: Toggle between Degrees and Radians for angular input.
- Coordinate Table: A history log that lists previous conversions during the current session.
- Copy-to-Clipboard: One-click functionality to copy converted coordinates.
- Zero-Latency UI: Optimized for high-speed responsiveness with micro-interactions.
UI Layout
- Header: Clean, minimalist title with a descriptive tagline.
- Main Tool Area: Split-screen layout (on desktop) or vertical stack (on mobile).
- Left/Top Panel: Control inputs including numerical fields for 'r' and 'θ', toggle switches for units, and an equation entry field.
- Right/Bottom Panel: Interactive SVG/Canvas graph area showing the Cartesian plane, including zoom and pan controls.
- Results Section: A clean, tabular list below the main tool displaying the session history of conversions.
Color Palette
- Background: Crisp White (#FFFFFF) and Soft Gray (#F9FAFB).
- Primary Accent: Professional Indigo (#4F46E5) for active elements and buttons.
- Secondary Accent: Slate Gray (#64748B) for labels and secondary text.
- Graph Elements: High-contrast Teal (#0D9488) for the plotted line and Orange (#F97316) for specific points.
Animations & Micro-interactions
- Smooth Transitions: All UI state changes (e.g., unit toggling) utilize CSS transitions (ease-in-out).
- Canvas Scaling: When parameters are updated, the graph redraws with a subtle fade animation rather than a jarring jump.
- Button Feedback: Buttons scale slightly (98%) on click to provide tactile satisfaction.
Technical Constraints & Compliance
- Architecture: Single-file HTML (embedded CSS in
<style>and JS in<script>tags). - Data Management: All state held in JS variables (
letorconst). Absolutely NOlocalStorage,sessionStorage, or cookies. - Environment: Must run in a sandboxed iframe. Use
window.postMessagefor parent communication if needed, but do not rely on it for app function. - Dependencies: Tailwind CSS via CDN for styling;
chart.jsorplotly.js(via CDN) for graphing engine optimization. - Styling: Force clean light mode; remove all browser default margins and styling.
Spread the word
gemini-3.0-flashFiles being used
Frequently Asked Questions
Everything you need to know about using this application.
How do you convert polar coordinates to Cartesian coordinates?
Converting polar coordinates (r, θ) to Cartesian coordinates (x, y) is done using standard trigonometric formulas. The x-coordinate is calculated by multiplying the radius (r) by the cosine of the angle (θ), expressed as x = r * cos(θ). The y-coordinate is found by multiplying the radius by the sine of the angle, expressed as y = r * sin(θ). Our tool automates this process instantly. By inputting your radius and angle (in degrees or radians), the calculator handles the trigonometric operations behind the scenes, providing the precise (x, y) coordinate pair without the need for manual calculation or scientific calculators.
Does this tool support graphing polar equations?
Yes, this application features a robust graphing engine designed to render polar equations directly in your browser. You can input common polar function formats, and the tool will calculate the necessary (x, y) sets to plot the curve accurately on a coordinate plane. This functionality allows students and professionals to visualize how changes in parameters—such as the radius or frequency of the angle—impact the visual shape of the graph, such as roses, spirals, or limaçons, providing a powerful visual learning aid for coordinate geometry.
Is this tool mobile-friendly and responsive?
Absolutely. This coordinate converter and grapher is built with a responsive-first approach, ensuring the interface remains fully functional on smartphones, tablets, and desktop computers. The canvas and control panels automatically resize to fit your screen resolution. Whether you are using it in a classroom on a laptop or checking coordinates on the go with a mobile device, the touch-friendly interface allows for precise input and clear visualization of data without sacrificing performance or usability.
Is my data stored or tracked when I use this tool?
We prioritize user privacy by design. This tool operates entirely on the client side, meaning all calculations are performed within your device's browser memory. We do not use cookies, localStorage, or databases, and no data is ever transmitted to a server. Because of this architecture, your inputs and calculations remain private and ephemeral. When you refresh the page or close your browser, all current session data is cleared, ensuring a completely anonymous and secure experience for every user.
Related Applications
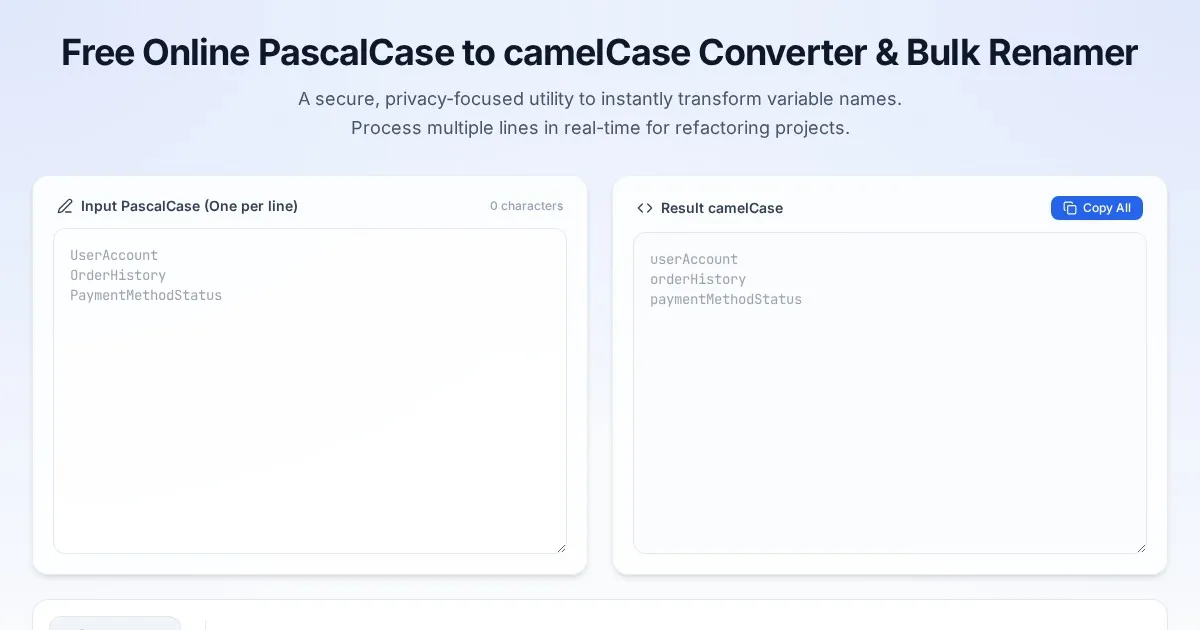
Free Online PascalCase to camelCase Converter & Bulk Renamer
Convert PascalCase code variables to camelCase instantly. A free, easy-to-use bulk variable renaming tool for developers. No server-side processing required.
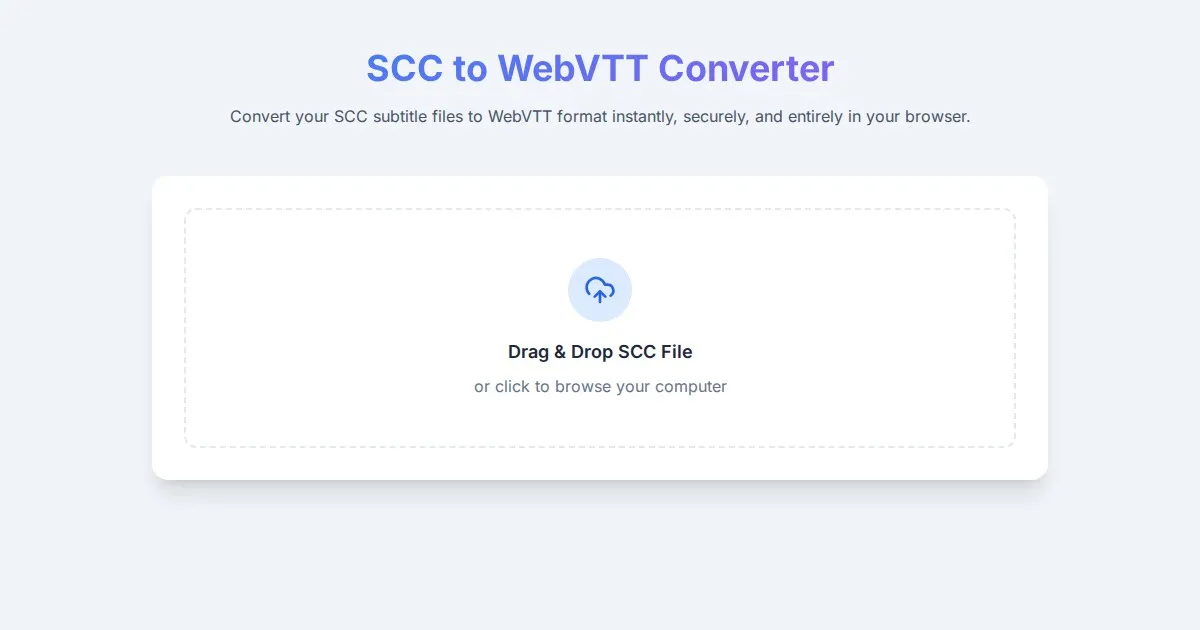
Free SCC to WebVTT Subtitle Converter Tool
Convert SCC subtitle files to WebVTT format online for free. Fast, secure, browser-based SCC to VTT conversion tool for video captioning and accessibility.
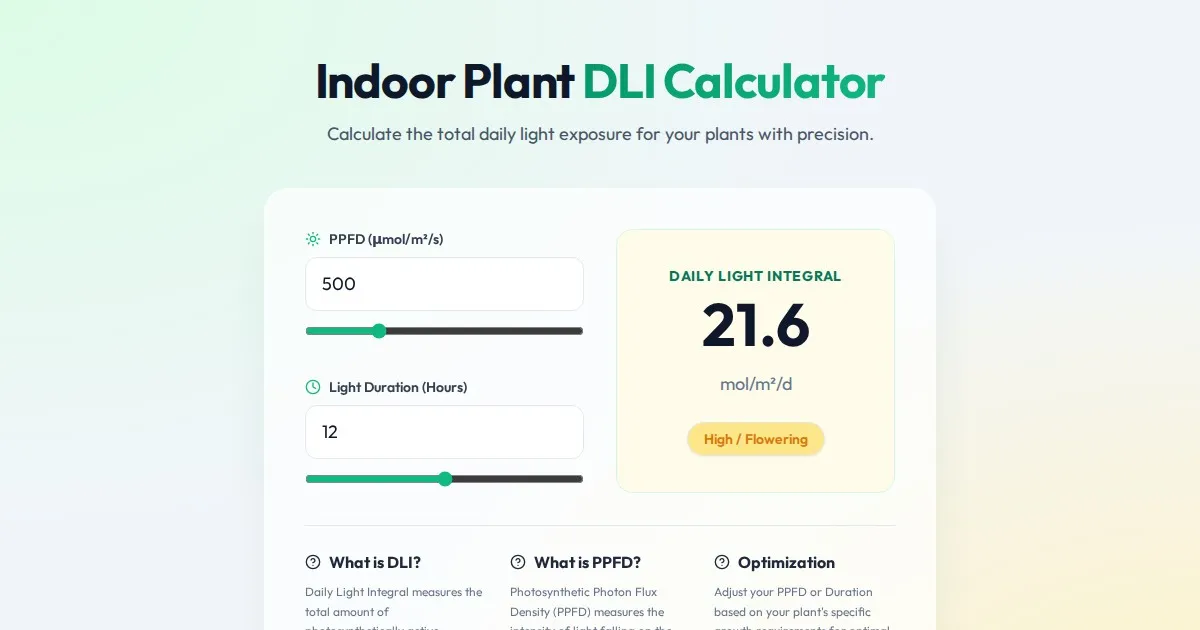
Free Indoor Plant Daily Light Integral (DLI) Calculator
Calculate the Daily Light Integral (DLI) and Photosynthetically Active Radiation (PAR) for your indoor plants. Optimize grow light hours and intensity today.
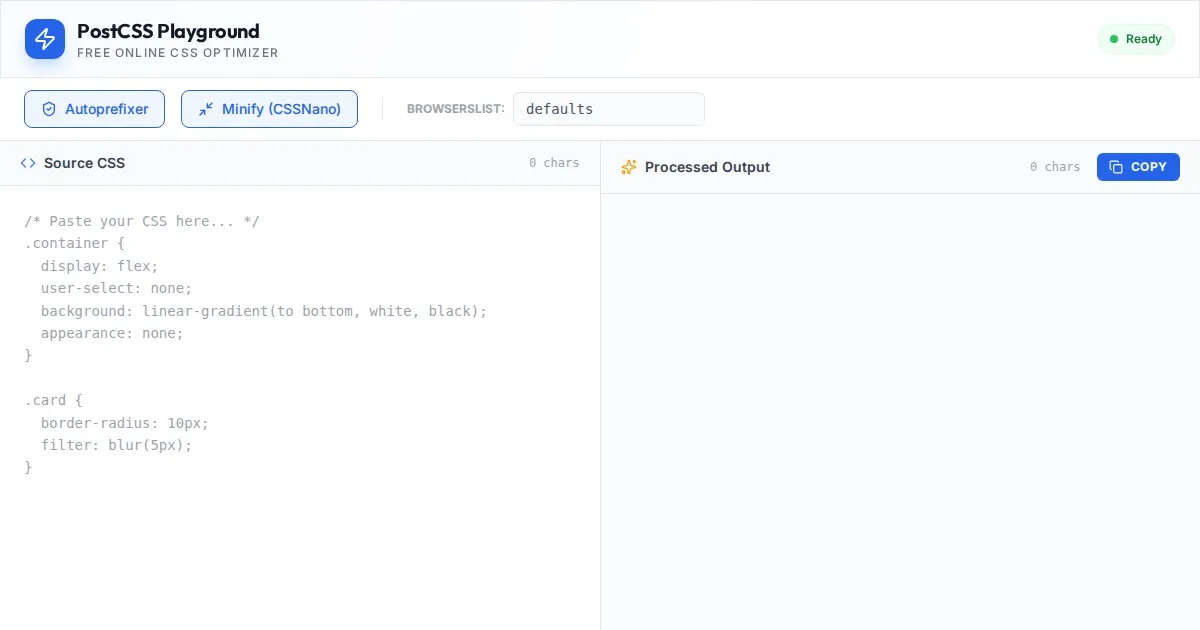
Free Online PostCSS Playground & CSS Minifier
Instantly process and optimize your CSS with this free online PostCSS tool. Apply Autoprefixer and CSSNano locally in your browser. No server processing required.
Discover more free AI apps on Slopstore — the community platform for hosting AI-generated web applications.