Free Typing Speed WPM Goal Progress Visualizer— gemini-3.0-flash
gemini-3.0-flashVisualize your typing speed growth with this free WPM goal setting curve calculator. Track your words per minute progress and plan your daily practice sessions.
AI Generation Prompt
Technical Specification: Typing Speed Goal Visualizer
Overview
A single-file, browser-based utility that helps typists visualize their progress toward a target Words Per Minute (WPM) goal. Users input their current speed, target speed, and time frame to generate a projected improvement curve and a daily practice schedule.
Core Features
- Dynamic Goal Projection: Real-time generation of a growth trajectory graph.
- Input Parameters: Current WPM, Target WPM, and Time Frame (in days or weeks).
- Visualization: Interactive chart plotting the required growth curve using a lightweight library like Chart.js (via CDN).
- Requirement Breakdown: Display of daily or weekly WPM increase needed to stay on track.
- Stateless Operation: No persistent storage used; all calculations happen in browser memory.
UI/UX Design
- Aesthetic: Professional, SaaS-inspired light mode. Use a crisp color palette (off-whites, soft grays, deep charcoal text, and a vibrant primary accent color like '#2563eb').
- Layout:
- Header: Clean title and brief instruction.
- Main Content: A two-column split layout. Left side contains the control panel (inputs); right side contains the visualization chart.
- Results Section: Located below the chart, showing key summary metrics like "Required daily WPM increase" and "Target date."
- Animations: Smooth CSS transitions for input focus states and a gentle fade-in animation for the chart upon data submission.
Technical Constraints
- Single File: Everything in one
.htmlfile. CSS in<style>blocks, JS in<script>blocks. - Performance: Zero external dependencies other than CDNs for styling (Tailwind CSS) and graphing (Chart.js).
- Sandbox Compatibility: Do NOT use
localStorage,sessionStorage, cookies, or any persistent browser data. State must be handled by JS objects. - Responsiveness: Use CSS Flexbox/Grid to collapse into a single-column layout on mobile devices.
- No Branding: Ensure no fictional logos, names, or unnecessary watermarks.
Spread the word
gemini-3.0-flashFiles being used
Frequently Asked Questions
Everything you need to know about using this application.
How do I calculate my actual words per minute (WPM)?
To determine your current WPM for this calculator, take a timed typing test. The industry standard calculation is (Total Keystrokes / 5) divided by the duration of the test in minutes. This establishes your "Net WPM," which serves as the most accurate baseline for tracking your progress. Always prioritize accuracy over raw speed when establishing your baseline. If your error rate is too high, your calculated WPM will not reflect your actual typing proficiency. A clean, accurate foundation ensures your goal-setting projections are realistic and achievable.
Does this application save my data between sessions?
This application is built as a stateless, single-file utility. Because it relies on in-memory computation rather than persistent storage mechanisms like cookies, IndexedDB, or local storage, your session data is automatically cleared upon refreshing the page or closing the tab. This design philosophy ensures a private, secure experience that functions identically in any modern browser environment without requiring permissions. We recommend using the built-in browser print or screenshot features to document your generated goals for future reference.
What is the ideal WPM improvement rate?
A realistic improvement rate depends heavily on your current skill level and the amount of daily practice time you can commit. Beginners often see faster initial gains, while experienced typists may see more gradual improvements as they reach the higher tiers of speed. Generally, targeting a 5% to 10% increase in speed per month is a sustainable approach for most learners. This incremental strategy helps avoid common plateaus where typing speed increases but accuracy drops significantly, which is a frequent pitfall for those practicing too aggressively.
How should I use the generated projection curve?
The projected curve illustrates the necessary velocity of improvement required to reach your target by your chosen deadline. It calculates the necessary daily increment, assuming a linear improvement model based on your inputs and time constraints. Use this visualization to adjust your expectations. If the projected curve looks too steep or unrealistic, consider extending your deadline to make the required daily effort more manageable. Breaking a large objective into small, daily milestones is the most effective way to ensure long-term consistency.
Related Applications

Free Online PascalCase to camelCase Converter & Bulk Renamer
Convert PascalCase code variables to camelCase instantly. A free, easy-to-use bulk variable renaming tool for developers. No server-side processing required.
Free SCC to WebVTT Subtitle Converter Tool
Convert SCC subtitle files to WebVTT format online for free. Fast, secure, browser-based SCC to VTT conversion tool for video captioning and accessibility.
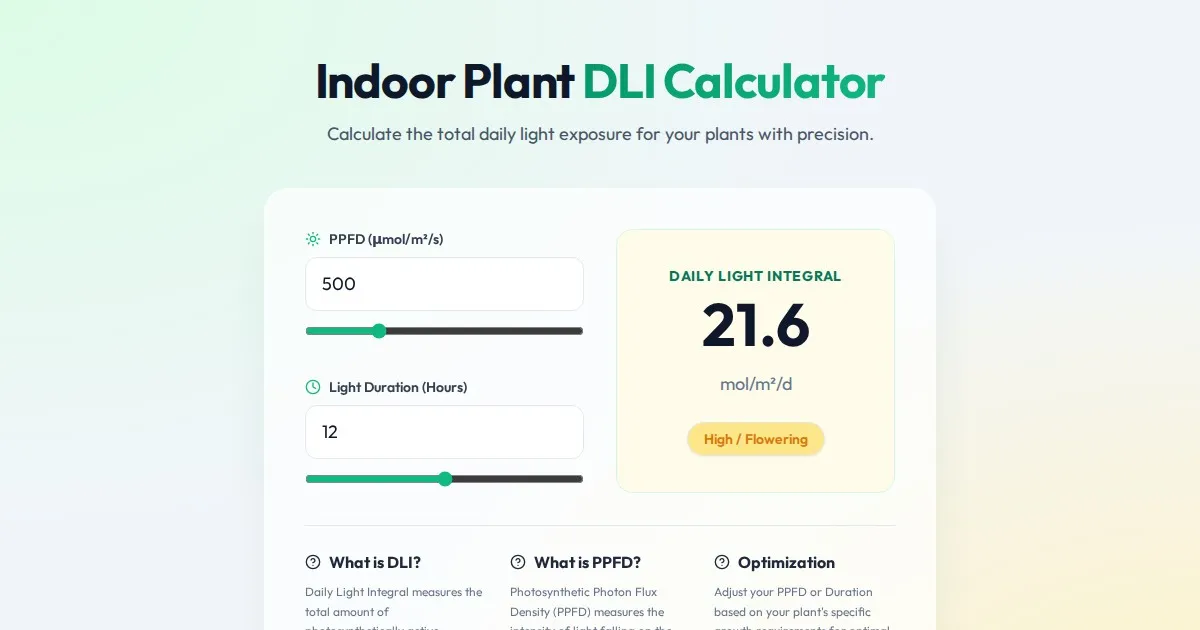
Free Indoor Plant Daily Light Integral (DLI) Calculator
Calculate the Daily Light Integral (DLI) and Photosynthetically Active Radiation (PAR) for your indoor plants. Optimize grow light hours and intensity today.
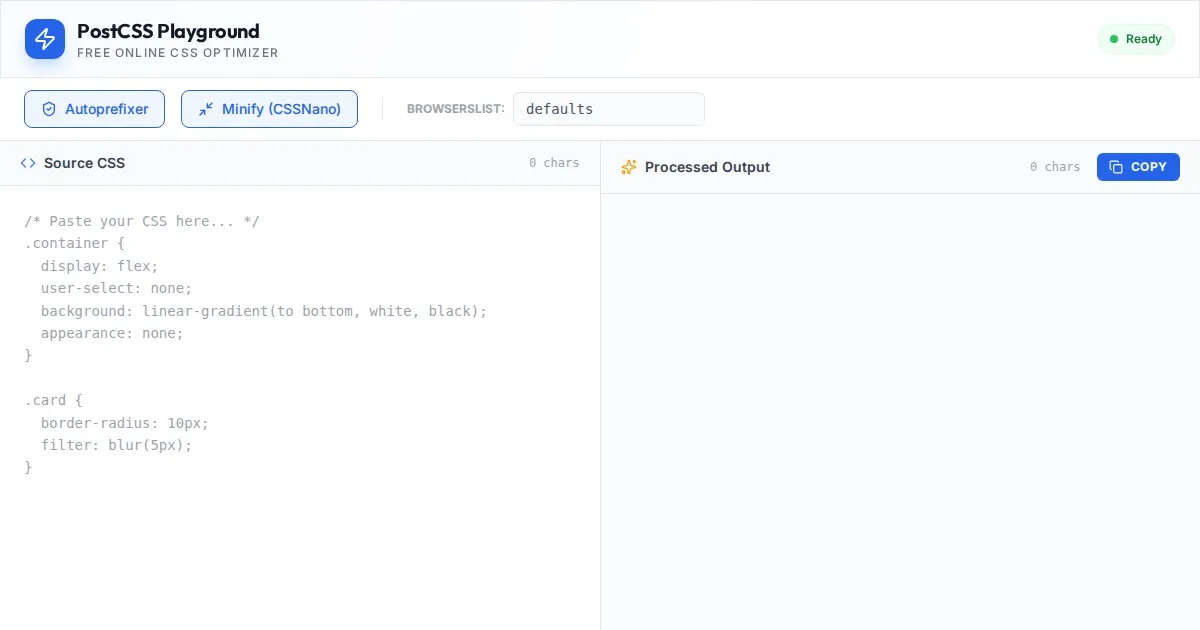
Free Online PostCSS Playground & CSS Minifier
Instantly process and optimize your CSS with this free online PostCSS tool. Apply Autoprefixer and CSSNano locally in your browser. No server processing required.
Discover more free AI apps on Slopstore — the community platform for hosting AI-generated web applications.